Comparative Study
. 2010 Oct;28(10):1106-14.
doi: 10.1038/nbt.1681. Epub 2010 Sep 19.

Quantitative comparison of genome-wide DNA methylation mapping technologies

Affiliations
Comparative Study

Quantitative comparison of genome-wide DNA methylation mapping technologies

Christoph Bock et al. Nat Biotechnol. 2010 Oct.

Abstract

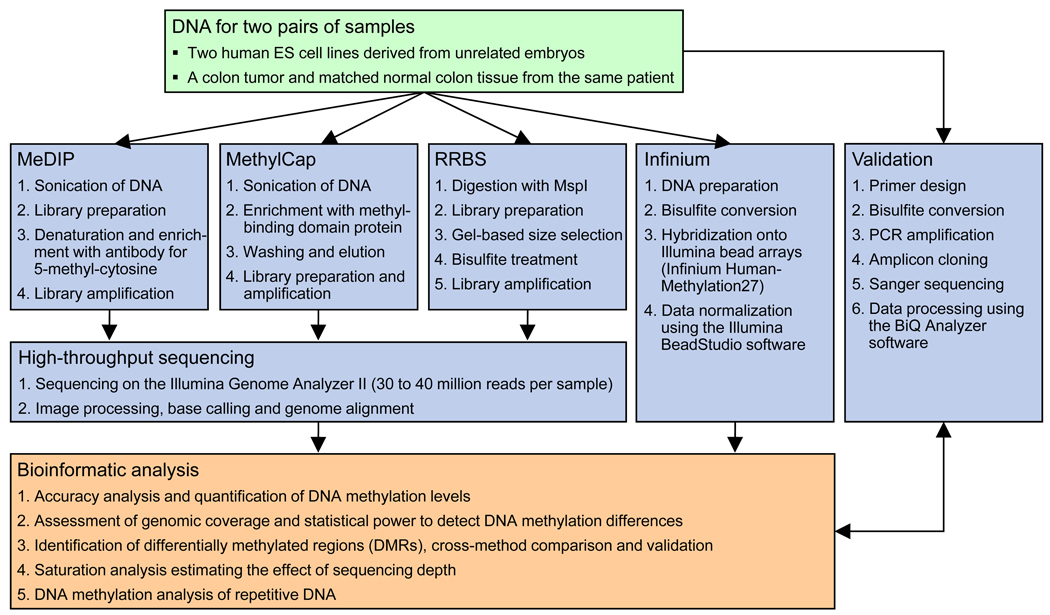
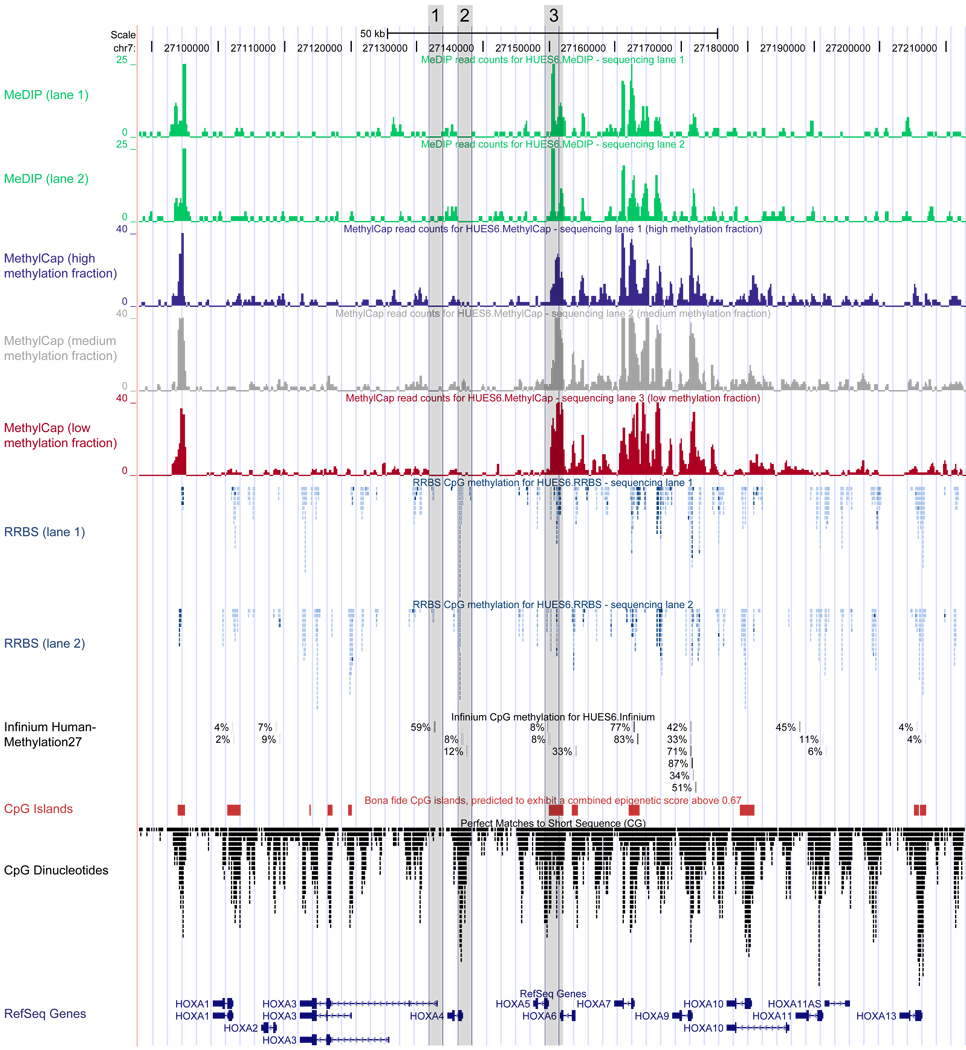
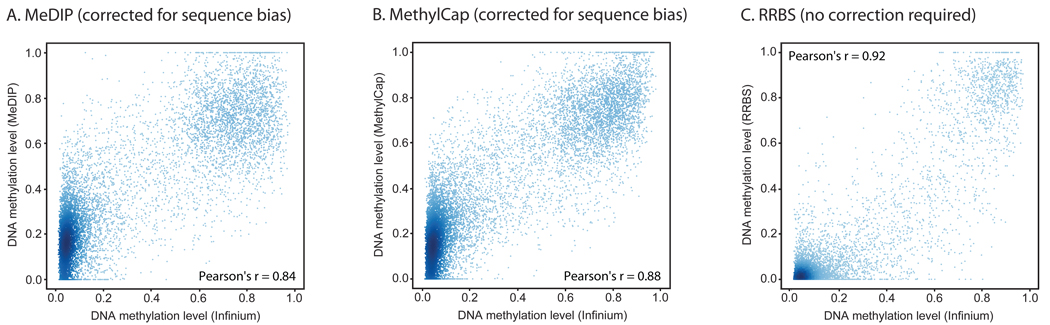
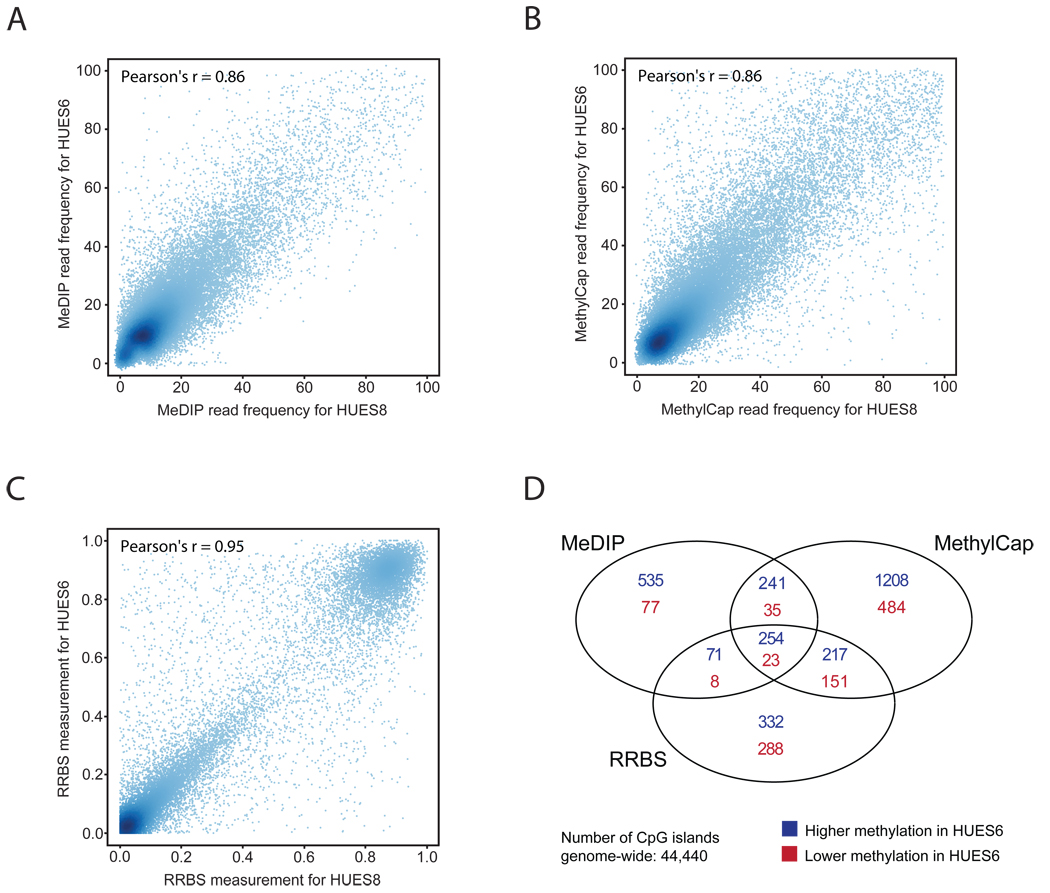
DNA methylation plays a key role in regulating eukaryotic gene expression. Although mitotically heritable and stable over time, patterns of DNA methylation frequently change in response to cell differentiation, disease and environmental influences. Several methods have been developed to map DNA methylation on a genomic scale. Here, we benchmark four of these approaches by analyzing two human embryonic stem cell lines derived from genetically unrelated embryos and a matched pair of colon tumor and adjacent normal colon tissue obtained from the same donor. Our analysis reveals that methylated DNA immunoprecipitation sequencing (MeDIP-seq), methylated DNA capture by affinity purification (MethylCap-seq), reduced representation bisulfite sequencing (RRBS) and the Infinium HumanMethylation27 assay all produce accurate DNA methylation data. However, these methods differ in their ability to detect differentially methylated regions between pairs of samples. We highlight strengths and weaknesses of the four methods and give practical recommendations for the design of epigenomic case-control studies.


Figures

Figure 1
Figure 1. Outline of the DNA methylation technology comparison
Four methods for DNA methylation mapping were compared on two pairs of samples. The resulting 16 DNA methylation maps were bioinformatically analyzed and benchmarked against each other. In addition, clonal bisulfite sequencing was performed on selected genomic regions to validate DNA methylation differences that were detected exclusively by one method.
Figure 2
Figure 2. Comparison of DNA methylation maps obtained with MeDIP, MethylCap, RRBS and Infinium
DNA methylation maps were generated using MeDIP (first two tracks, in green), MethylCap (three tracks in blue, grey and red), RRBS (stacked blue tracks) and Infinium (single black track with percentage values) and converted into UCSC Genome Browser tracks. The screenshot shows the HOXA cluster in a human ES cell line (HUES6). Each track represents data from a single sequencing lane (MeDIP, MethylCap, RRBS) or microarray hybridization (Infinium). MeDIP and MethylCap data are visually similar to ChIP-seq data, with peaks in regions that exhibit high density of the target molecule (5-methyl-cytosine) and troughs in regions with low density of methylated cytosines. The height of the peaks represents the number of reads in each genomic interval, for each track normalized to the same genome-wide read count (note the twofold compressed scaling of the MethylCap tracks relative to the MeDIP tracks, which is indicative of higher dynamic range for MethylCap compared to MeDIP). RRBS gives rise to clusters of CpGs with absolute DNA methylation measurements, separated by regions that are not covered due to the reduced-representation property of the RRBS protocol. Each data point corresponds to the methylation level at a single CpG, and dark blue points indicate higher methylation levels than light blue points. Infinium data is represented in a similar way as the RRBS data, and the methylation levels at single CpGs are shown as percentage values. The three grey columns highlight regions that are illustrative of specific properties of the enrichment methods: (1) A promoter region that is CpG-poor and therefore not detectable by MeDIP or MethylCap – independent of its DNA methylation level; (2) a promoter region that contains many CpGs but low levels of DNA methylation, which also results in the absence of MeDIP and MethylCap peaks; and (3) a CpG island that exhibits a strong enrichment peak for both MeDIP and MethylCap although the RRBS data indicates that it is only partially methylated. For reference, the CpG density is indicated by stacked points (black) at the bottom of the diagram, and CpG islands (red) as well as known genes (blue) are listed as described previously,. All DNA methylation maps are available online as custom tracks for interactive visualization in the UCSC Genome Browser (http://meth-benchmark.computational-epigenetics.org/).
Figure 3
Figure 3. Quantification of DNA methylation with MeDIP, MethylCap and RRBS
Absolute DNA methylation levels were calculated from the data obtained by MeDIP (panel A), MethylCap (panel B) and RRBS (panel C), respectively, and compared to DNA methylation levels determined by the Infinium assay. For MeDIP and MethylCap, sequencing reads were counted in 1-kilobase regions surrounding each CpG that is interrogated by the Infinium assay, and a regression model was used to infer absolute DNA methylation levels. Scatterplots and correlation coefficients were calculated on a test set that was not used for model fitting or feature selection. For RRBS, the DNA methylation level was determined as the percentage of methylated CpGs within 200 basepairs surrounding each CpG that is interrogated by the Infinium assay. Data shown are for the HUES6 human ES cell line, and regions that did not have sufficient sequencing coverage were excluded.
Figure 4
Figure 4. Genomic coverage of MeDIP, MethylCap, RRBS and Infinium
Genomic coverage was quantified by the number of DNA methylation measurements that overlap with CpG islands (top row), gene promoters (center row) and a 1-kilobase tiling of the genome (bottom row). For MeDIP and MethylCap, the number of measurements is equal to the number of unique sequencing reads that fall inside each region. For RRBS, it refers to the number of valid DNA methylation measurements at CpGs within each region (one RRBS sequencing read typically yields one measurement, but can also give rise to more than one measurement if it contains several CpGs). For Infinium, the number of measurements is equal to the number of CpGs within each region that are present on the HumanMethylation27 microarray. CpG islands were calculated using CgiHunter (http://cgihunter.bioinf.mpi-inf.mpg.de/), requiring a minimum CpG observed vs. expected ratio of 0.6, a minimum GC content of 0.5 and a minimum length of 700 basepairs. Promoter regions were calculated based on Ensembl gene annotations, such that the region starts one kilo-base upstream of the annotated transcription start site (TSS) and extends to one kilobase downstream of the TSS. The genomic tiling was obtained by sliding a 1-kilobase window through the genome such that each tile starts at the position where the previous tile ends. No repeat-masking was performed for any of the three types of genomic regions. Data are shown for the HUES6 human ES cell line.
Figure 5
Figure 5. Detection of differentially methylated regions with MeDIP, MethylCap and RRBS
Average DNA methylation measurements were calculated for each CpG island and compared between two human ES cell lines (HUES6 and HUES8). Total read frequencies are shown for MeDIP (panel A) and MethylCap (panel B), and mean DNA methylation levels are shown for RRBS (panel C). Regions with insufficient sequencing coverage were excluded. The Venn diagram (panel D) displays the total number and mutual overlap of differentially methylated CpG islands that could be identified by each method. CpG islands were classified as hypermethylated or hypomethylated (depending on the directionality of the difference) if the absolute DNA methylation difference exceeded 20% (for RRBS) or if there was at least a twofold difference in read number between the two samples (for MeDIP and MethylCap) – but only if Fisher’s exact test with multiple-testing correction gave rise to an estimated false-discovery rate of differential DNA methylation that was less than 0.1.

Comment in

Similar articles

Cited by

References

    1. Baylin SB, Ohm JE. Epigenetic gene silencing in cancer - a mechanism for early oncogenic pathway addiction? Nat Rev Cancer. 2006;6(2):107–116. - PubMed
    1. Esteller M. Epigenetics in cancer. N Engl J Med. 2008;358(11):1148–1159. - PubMed
    1. Feinberg AP, Tycko B. The history of cancer epigenetics. Nat Rev Cancer. 2004;4(2):143–153. - PubMed
    1. Issa JP. CpG island methylator phenotype in cancer. Nat Rev Cancer. 2004;4(12):988–993. - PubMed
    1. Jones PA, Laird PW. Cancer epigenetics comes of age. Nat Genet. 1999;21(2):163–167. - PubMed

Publication types