

Saccadic latency in hepatic encephalopathy: a pilot study
- PMID: 20852922
- PMCID: PMC2972426
- DOI: 10.1007/s11011-010-9210-1
Saccadic latency in hepatic encephalopathy: a pilot study
Abstract
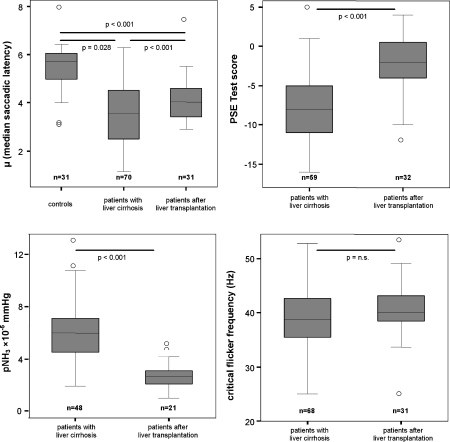
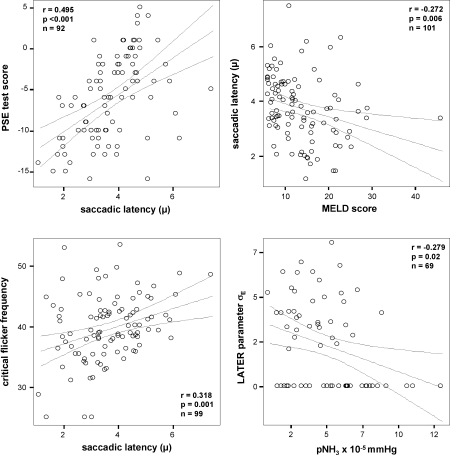
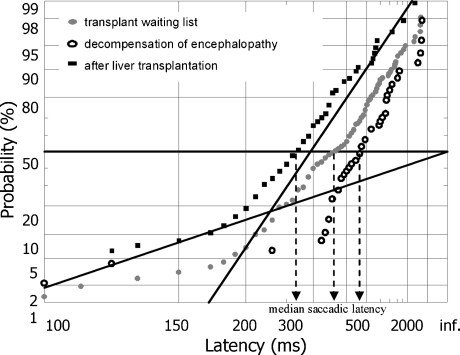
Hepatic encephalopathy is a common complication of cirrhosis. The degree of neuro-psychiatric impairment is highly variable and its clinical staging subjective. We investigated whether eye movement response times-saccadic latencies-could serve as an indicator of encephalopathy. We studied the association between saccadic latency, liver function and paper- and pencil tests in 70 patients with cirrhosis and 31 patients after liver transplantation. The tests included the porto-systemic encephalopathy (PSE-) test, critical flicker frequency, MELD score and ammonia concentration. A normal range for saccades was established in 31 control subjects. Clinical and biochemical parameters of liver, blood, and kidney function were also determined. Median saccadic latencies were significantly longer in patients with liver cirrhosis when compared to patients after liver transplantation (244 ms vs. 278 ms p < 0.001). Both patient groups had prolonged saccadic latency when compared to an age matched control group (175 ms). The reciprocal of median saccadic latency (μ) correlated with PSE tests, MELD score and critical flicker frequency. A significant correlation between the saccadic latency parameter early slope (σ(E)) that represents the prevalence of early saccades and partial pressure of ammonia was also noted. Psychometric test performance, but not saccadic latency, correlated with blood urea and sodium concentrations. Saccadic latency represents an objective and quantitative parameter of hepatic encephalopathy. Unlike psychometric test performance, these ocular responses were unaffected by renal function and can be obtained clinically within a matter of minutes by non-trained personnel.
Conflict of interest statement
FK, JR, MS, IWG, VW and HZ have no conflict of interest. RHSC is an unpaid director of a company distributing the saccadometer.
Figures

Similar articles
-
Using saccades to diagnose covert hepatic encephalopathy.Metab Brain Dis. 2015 Jun;30(3):821-8. doi: 10.1007/s11011-014-9647-8. Epub 2015 Jan 15. Metab Brain Dis. 2015. PMID: 25586511
-
Saccadic latency is prolonged in Spinocerebellar Ataxia type 2 and correlates with the frontal-executive dysfunctions.J Neurol Sci. 2011 Jul 15;306(1-2):103-7. doi: 10.1016/j.jns.2011.03.033. Epub 2011 Apr 9. J Neurol Sci. 2011. PMID: 21481421
-
Saccades in adult Niemann-Pick disease type C reflect frontal, brainstem, and biochemical deficits.Neurology. 2009 Mar 24;72(12):1083-6. doi: 10.1212/01.wnl.0000345040.01917.9d. Neurology. 2009. PMID: 19307542
-
The tell-tale tasks: a review of saccadic research in psychiatric patient populations.Brain Cogn. 2008 Dec;68(3):371-90. doi: 10.1016/j.bandc.2008.08.024. Epub 2008 Oct 23. Brain Cogn. 2008. PMID: 18950927 Free PMC article. Review.
-
Review article: the modern management of hepatic encephalopathy.Aliment Pharmacol Ther. 2010 Mar;31(5):537-47. doi: 10.1111/j.1365-2036.2009.04211.x. Epub 2009 Dec 7. Aliment Pharmacol Ther. 2010. PMID: 20002027 Review.
Cited by
-
Measurement of Saccade Parameters in Relation to Adaptation to Homonymous Hemianopia.Br Ir Orthopt J. 2022 Sep 28;18(1):130-143. doi: 10.22599/bioj.272. eCollection 2022. Br Ir Orthopt J. 2022. PMID: 36247823 Free PMC article.
-
Minimal hepatic encephalopathy is associated to alterations in eye movements.Sci Rep. 2022 Oct 7;12(1):16837. doi: 10.1038/s41598-022-21230-3. Sci Rep. 2022. PMID: 36207472 Free PMC article.
-
Using saccades to diagnose covert hepatic encephalopathy.Metab Brain Dis. 2015 Jun;30(3):821-8. doi: 10.1007/s11011-014-9647-8. Epub 2015 Jan 15. Metab Brain Dis. 2015. PMID: 25586511
-
Ultrafast initiation of a neural race by impending errors.J Physiol. 2015 Oct 1;593(19):4471-84. doi: 10.1113/JP270842. Epub 2015 Aug 19. J Physiol. 2015. PMID: 26226854 Free PMC article.
References
Publication types
MeSH terms
LinkOut - more resources
Full Text Sources
Medical
Research Materials
