. 2010 Nov 1;518(21):4375-94.
doi: 10.1002/cne.22462.

Tuberoinfundibular peptide of 39 residues modulates the mouse hypothalamic-pituitary-adrenal axis via paraventricular glutamatergic neurons

Affiliations

Tuberoinfundibular peptide of 39 residues modulates the mouse hypothalamic-pituitary-adrenal axis via paraventricular glutamatergic neurons

Eugene Dimitrov et al. J Comp Neurol. .

Abstract

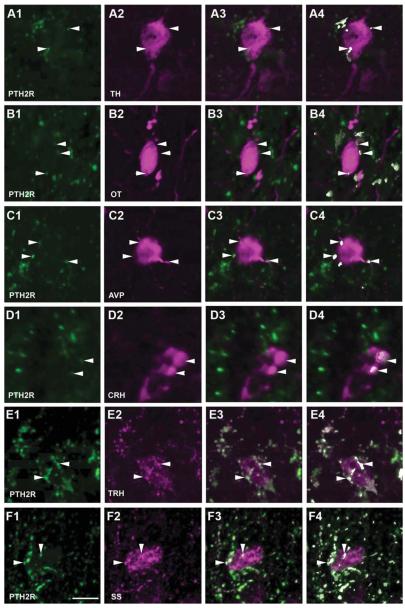
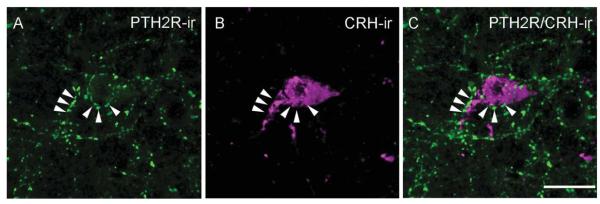
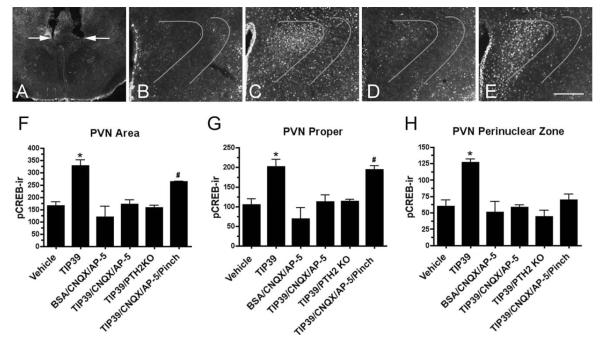
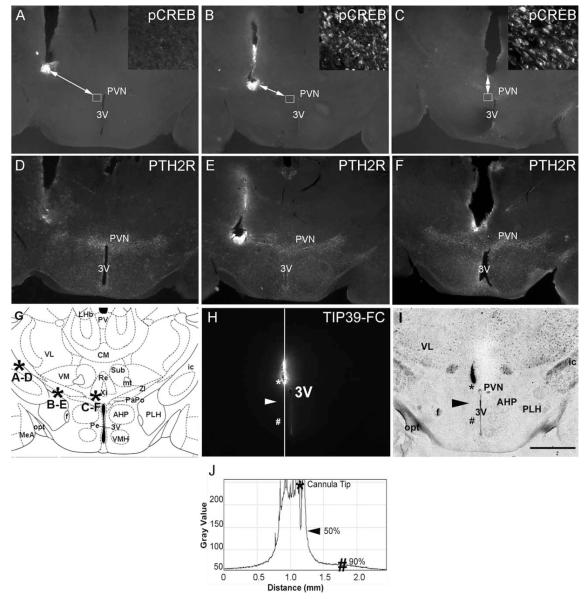
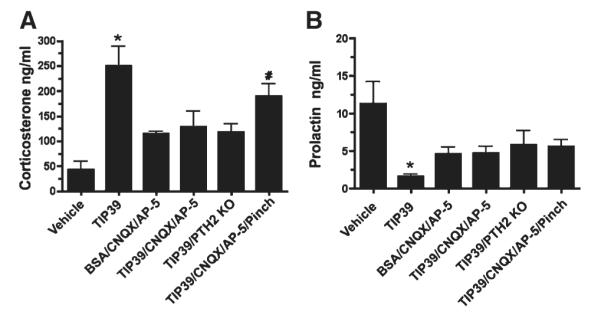
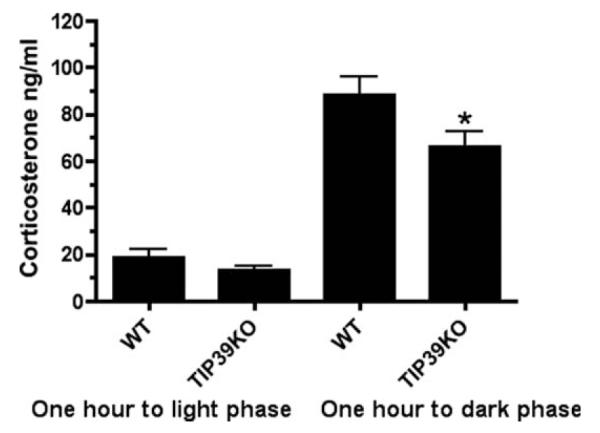
Neurons in the subparafascicular area at the caudal border of the thalamus that contain the neuropeptide tuberoinfundibular peptide of 39 residues (TIP39) densely innervate several hypothalamic areas, including the paraventricular nucleus (PVN). These areas contain a matching distribution of TIP39's receptor, the parathyroid hormone receptor 2 (PTH2R). Frequent PTH2R coexpression with a vesicular glutamate transporter (VGlut2) suggests that TIP39 could presynaptically regulate glutamate release. By using immunohistochemistry we found CRH-ir neurons surrounded by PTH2R-ir fibers and TIP39-ir axonal projections in the PVN area of the mouse brain. Labeling hypothalamic neuroendocrine neurons by peripheral injection of fluorogold in PTH2R-lacZ knock-in mice showed that most PTH2Rs are on PVN and peri-PVN interneurons and not on neuroendocrine cells. Double fluorescent in situ hybridization revealed a high level of coexpression between PTH2R and VGlut2 mRNA by cells located in the PVN and nearby brain areas. Local TIP39 infusion (100 pmol) robustly increased pCREB-ir in the PVN and adjacent perinuclear zone. It also increased plasma corticosterone and decreased plasma prolactin. These effects of TIP39 on pCREB-ir, corticosterone, and prolactin were abolished by coinfusion of the ionotropic glutamate receptor antagonists 6-cyano-7-nitroquinoxaline-2,3-dione (CNQX) and DL-2-amino-5-phosphonopentanoic acid (AP-5; 30 pmol each) and were absent in PTH2R knockout mice. Basal plasma corticosterone was slightly decreased in TIP39 knockout mice just before onset of their active phase. The present data indicate that the TIP39 ligand/PTH2 receptor system provides facilitatory regulation of the hypothalamic-pituitary-adrenal axis via hypothalamic glutamatergic neurons and that it may regulate other neuroendocrine systems by a similar mechanism.


Figures

Figure 1
Figure 1
Generation and genotyping of PTH2R knockout mice. A 10-kb PTH2R fragment extending from A to Y was used for recombination. ES clones with homologous recombination were identified by Southern blot using BamH1 digestion and the indicated probe sequence (asterisk). PCR of genomic DNA using primers Pf2 and Pr1 produced a 635-bp band from a wild-type (WT) allele, primers Vf1 and Pr1 produced a 775-bp band from the floxed-exon-5 (Flox) allele, and primers Pf1 and Pr1 produced a 507-bp band from the exon-5-deleted (KO) allele.
Figure 2
Figure 2
Coexpression between PTH2R and VGlut2 immunoreactivity and PTH2R and VGlut2 mRNA in the PVN area. High-magnification confocal images show PTH2R-ir fibers (A; green), VGlut2-ir fibers (B; magenta), and a merged image (C). Open arrowheads point to a fiber with only PTH2R-ir, solid arrowheads to a fiber with only VGlut2-ir, and arrows to PTH2R-ir/VGlut2-ir fibers. D: Distribution of PTH2R mRNA in the dorsal part of the PVN and adjacent peri-PVN area as detected by fluorescent in situ hybridization. The arrowheads point to cells expressing PTH2R mRNA (green). E shows DAPI counterstaining (blue), which aids visualization of the anatomical distribution of the mRNA signal. F is a merged image of the PTH2R mRNA signal and the DAPI counterstain. The curved line indicates the approximate position of the PVN. High-magnification confocal images in the third row show expression of VGlut2 mRNA (G;green), PTH2R mRNA (H; magenta), and a merged image (I). Arrow points to a double-labeled cell and an arrowhead to a cell containing only PTH2R signal. Controls with riboprobes omitted show specificity of the immunodetection of VGlut2 (J)and PTH2R (K) haptens. L: Enlarged image of the boxed area in F. 3V, Third ventricle; DC, paraventricular dorsal cap parvocellular cell group; LM, paraventricular lateral magnocellular cell group; MP, paraventricular medial parvocellular cell group. Scale bars 10 μm in C (applies to A–C); 10 μm in I (applies to G–I); 10 μm in K (applies to J–L); 100 μm in F (applies to D–F). [Color figure can be viewed in the online issue, which is available at wileyonlinelibrary.com.]
Figure 3
Figure 3
PTH2R, TIP39, and glutamate immunoreactivity in the hypothalamic paraventricular nucleus (PVN) and the adjacent region of the anterior hypothalamus. Dense networks of PTH2R-ir (A; green), TIP39-ir (B; cyan), and glutamate-ir (C; magenta) fibers are present in the PVN as well as in the adjacent peri-PVN zone, as shown at −0.94 mm to bregma (Franklin and Paxinos, 2008). A–C are widefield images. DF are confocal images of β-gal-ir distribution in the PVN area at the indicated levels from a PTH2R lacZ knock-in mouse. Fluorogold (FG-ir)-labeled neuroendocrine neurons that define the neuroendocrine part of PVN are shown in magenta. β-Gal-ir is contained in minute precipitates (green specks). Examples within the PVN are indicated with arrows and in the adjacent area with arrowheads. GI: Higher magnification images from the boxed PVN region in E show β-gal-ir (G), FG-ir (H), and a merged image (I), with little apparent coexpression between FG-ir and β-gal-ir. 3V, Third ventricle; AHC, anterior hypothalamic area, central; f, fornix; LH, lateral hypothalamus; opt, optic tract; PVN, paraventricular nucleus. Scale bars = 200 μm in C (applies to A–C); 100 μm in F (applies to D–F); 50 μm in I (applies to G–I). [Color figure can be viewed in the online issue, which is available at wileyonlinelibrary.com.]
Figure 4
Figure 4
Relationship among PTH2R-ir, TIP39-ir, and CRH-ir in the PVN. Images show PTH2R-ir (A; green), TIP39-ir (B; cyan), and CRH-ir (C; magenta) in the PVN. E (PTH2R-ir), F (TIP39-ir), G (CRH-ir), and H (PTH2R/TIP39/CRH-ir) are high-magnification images of the boxed area in D. Arrowheads point to PTH2R-ir, and arrows point to TIP39-ir labeled fibers adjacent to the same CRH-ir neuron (magenta). Images in E–H are 3D renderings created using the command “3D opacity” in Volocity 64 from a Z series of 12 0.5-μm sections covering 6 μm in the Z-axis. AHA, anterior hypothalamic area; MP, paraventricular medial parvocellular cell group; VP, paraventricular ventral parvocellular cell group. Scale bars = 100 μm in D (applies to A–D); 10 μm in H (applies to E–H). [Color figure can be viewed in the online issue, which is available at wileyonlinelibrary.com.]
Figure 5
Figure 5
Relationship between PTH2R and neuroendocrine immunoreactivity in the PVN area. PTH2R-ir fibers are green in all images. Magenta labels tyrosine hydroxylase (TH; A24), oxytocin (OT; B24), arginine-vasopressin (AVP; C24), corticotrophin-releasing hormone (CRH; D24), thyrotropin-releasing hormone (TRH; E14), and somatostatin (SS; F24). Single channels are shown in the first and second columns, merged images in the third column, and merged images in which regions containing suprathreshold levels of both labels are pseudocolored white are in the fourth column. Arrowheads and the white pseudocolor in the fourth column indicate touching points, as defined by areas that contain both green and magenta labeling above threshold. Images are single optical sections; analysis was performed on Z-series as described in Materials and Methods. Scale bar = 10 μm. [Color figure can be viewed in the online issue, which is available at wileyonlinelibrary.com.]
Figure 6
Figure 6
High-magnification image of PTH2R-ir fibers (A; green) and a CRH-ir cell (B; magenta) in the PVN. C shows PTH2R/CRH merged image of a CRH-ir neuron enveloped by PTH2R-ir fibers, indicated by arrowheads. The image is a 3D rendering created using the command “3D opacity” in Volocity 64 from a Z-series of 12 0.5-μm sections covering 6 lm in the Z-axis. Scale bar = 10 μm. [Color figure can be viewed in the online issue, which is available at wileyonlinelibrary.com.]
Figure 7
Figure 7
Expression of pCREB-ir after TIP39 infusion into the PVN. A: Typical cannula positions are indicated by arrows. B–E: Expression of pCREB-ir 15 minutes following test agent administration. B: Note very low expression after the infusion of vehicle. C: p-CREB-ir is present in the PVN and peri-PVN area following 100 pmol TIP39. D: Expression of p-CREB-ir is much less after the infusion of 100 pmol TIP39 plus 30 pmol each of CNQX and AP-5. E: p-CREB-ir is obvious in the PVN proper after the infusion of 100 pmol TIP39 plus CNQX/AP-5 (30 pmol each) followed by a hind paw pinch. DAPI counterstaining (not shown) was used to draw the curved lines that outline the peri-PVN zone where pCREB-ir was counted in addition to the PVN proper. Graphs show counts of the PVN neurons expressing pCREB-ir following administration of TIP39 with or without glutamate receptor blockers. F: PVN area (PVN nucleus plus peri-PVN zone). G: PVN nucleus proper. H: Peri-PVN zone. Significantly different from vehicle-treated animals, *P < 0.0001, #P < 0.001; ANOVA followed by Student-Neuman-Keuls test, n = 4–6/group. Scale bar = 100 μm.
Figure 8
Figure 8
Evaluation of TIP39 diffusion and dependence of p-CREB-ir expression in the PVN on injector placement. AC show p-CREB immunolabeling. DF show PTH2R immunolabeling of sections adjacent to the upper row sections. A and D show injector placement outside the PVN area expressing PTH2R-ir. B and E show injector placement at the border of the PVN area expressing PTH2R-ir. C and F show injector placement into the medial part of the PVN area expressing PTH2R-ir. Insets in A–C are high-magnification images of p-CREB-ir taken from the areas outlined by the small squares. The arrows in A–C connect the end point of injector tracks to the areas of p-CREB-ir expression shown in the inserts and are markers for the effective distance of TIP39 spread 15 minutes after infusion of 0.5 μl. G is a matched atlas plate (Franklin and Paxinos, 2008) of the brain area shown in the first six panels. Asterisks indicate the placement of injector tips with the corresponding panels indicated by letters. H shows the area covered by fluorescent labeled TIP39 (TIP39-FC) 15 minutes after the infusion of 0.5 μl into the PVN, as determined by plotting the gray value against the distance. The asterisks mark the injector tip and the peak intensity value. The arrowhead indicates a point of 50% decrease in signal intensity, and the number symbol indicates a point of 90% decrease in signal. I is a brightfield image of the field shown in H with visible anatomical landmarks. J plots gray value vs. distance along the white line in H, used to estimate TIP39 diffusion. 3V, Third ventricle; AHP, anterior hypothalamic area, posterior; CM, central medial thalamic nucleus; f, fornix; ic, internal capsule; mt, mammilothalamic tract; MeA, medial amygdala; opt, optic tract; PaPo, paraventricular hypothalamic nucleus, posterior; Pe, periventricular hypothalamic nucleus; PLH, peduncular part of the lateral hypothalamus; Re, reuniens thalamic nucleus; Sub, submedius thalamic nucleus; VM, ventromedial thalamic nucleus; VMH, ventromedial hypothalamic nucleus; VL, ventrolateral thalamic nucleus; ZI, zona incerrta. Scale bar = 0.5 mm.
Figure 9
Figure 9
Plasma hormone levels following administration of TIP39 with or without glutamate receptor blockers. A: Plasma corticosterone. B: Plasma prolactin. Treatment groups as defined in the legend to Figure 8. Significantly different from vehicle-treated animals, *P < 0.0006, #P < 0.01; ANOVA followed by Student-Neuman-Keuls test, n = 4–7/group.
Figure 10
Figure 10
Plasma corticosterone levels in wild-type (WT) and TIP39 knockout (KO) mice 1 hour before the light phase and 1 hour before the dark phase of the day. Significantly different from wild-type mice at the same time point, *P < 0.01; ANOVA followed by Student-Neuman-Keuls test, n = 8–13/group.

Similar articles

Cited by

References

    1. Alon T, Zhou L, Perez CA, Garfield AS, Friedman JM, Heisler LK. Transgenic mice expressing green fluorescent protein under the control of the corticotropin-releasing hormone promoter. Endocrinology. 2009;150:5626–5632. - PMC - PubMed
    1. Ben-Barak Y, Russell JT, Whitnall M, Ozato K, Gainer H. Phylogenetic cross-reactivities of monoclonal antibodies produced against rat neurophysin. Cell Mol Neurobiol. 1984;4:339–349. - PMC - PubMed
    1. Bjorklund A, Nobin A. Fluorescence histochemical and microspectrofluorometric mapping of dopamine and noradrena-line cell groups in the rat diencephalon. Brain Res. 1973;51:193–205. - PubMed
    1. Boudaba C, Szabo K, Tasker JG. Physiological mapping of local inhibitory inputs to the hypothalamic paraventricular nucleus. J Neurosci. 1996;16:7151–7160. - PMC - PubMed
    1. Bregonzio C, Navarro CE, Donoso AO. NMDA receptor antagonists block stress-induced prolactin release in female rats at estrus. Eur J Pharmacol. 1998;350:259–265. - PubMed

Publication types

MeSH terms

Substances