

The acquired preparedness model of risk for bulimic symptom development
- PMID: 20853933
- PMCID: PMC2946629
- DOI: 10.1037/a0018257
The acquired preparedness model of risk for bulimic symptom development
Abstract
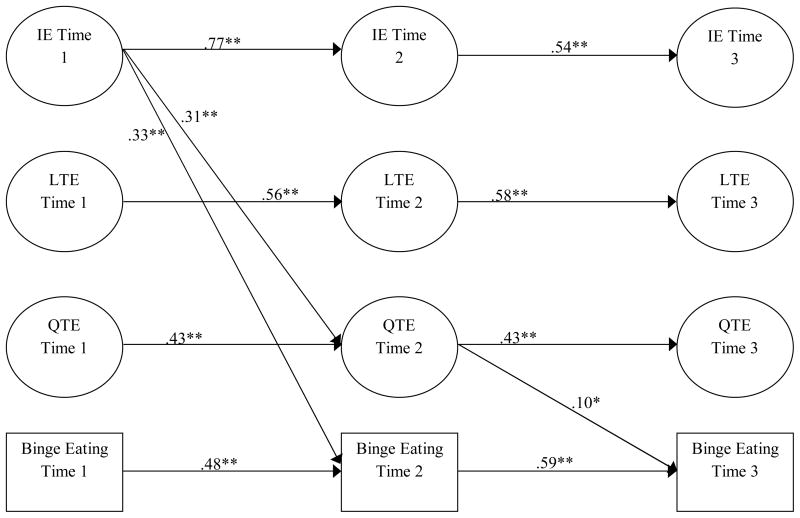
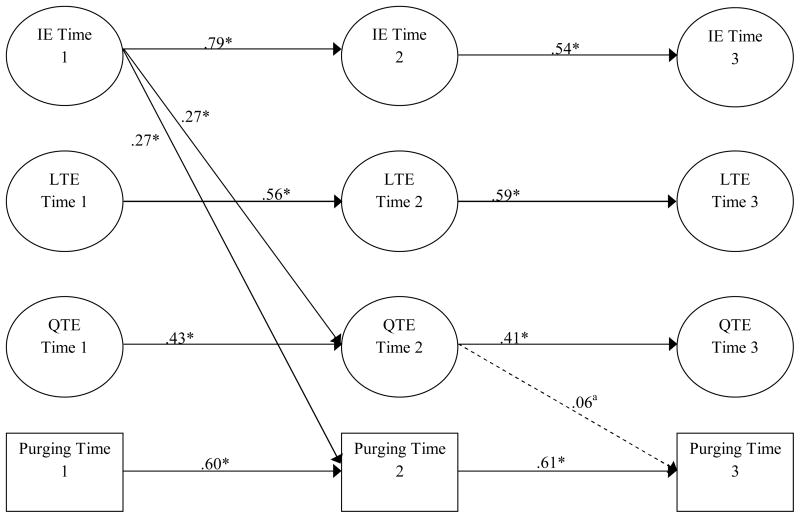
The authors applied person-environment transaction theory to test the acquired preparedness model of eating disorder risk. The model holds that (a) middle-school girls high in the trait of ineffectiveness are differentially prepared to acquire high-risk expectancies for reinforcement from dieting or thinness; (b) those expectancies predict subsequent binge eating and purging; and (c) the influence of the disposition of ineffectiveness on binge eating and purging is mediated by dieting or thinness expectancies. In a three-wave longitudinal study of 394 middle-school girls, the authors found support for the model. Seventh-grade girls' scores on ineffectiveness predicted their subsequent endorsement of high-risk dieting or thinness expectancies, which in turn predicted subsequent increases in binge eating and purging. Statistical tests of mediation supported the hypothesis that the prospective relation between ineffectiveness and binge eating was mediated by dieting or thinness expectancies, as was the prospective relation between ineffectiveness and purging. This application of a basic science theory to eating disorder risk appears fruitful, and the findings suggest the importance of early interventions that address both disposition and learning.
Figures
Similar articles
-
Thinness and eating expectancies predict subsequent binge-eating and purging behavior among adolescent girls.J Abnorm Psychol. 2007 Feb;116(1):188-97. doi: 10.1037/0021-843X.116.1.188. J Abnorm Psychol. 2007. PMID: 17324029
-
A prospective test of the influence of negative urgency and expectancies on binge eating and purging.Psychol Addict Behav. 2013 Mar;27(1):294-300. doi: 10.1037/a0029323. Epub 2012 Jul 23. Psychol Addict Behav. 2013. PMID: 22823545
-
Bulimic symptom onset in young girls: A longitudinal trajectory analysis.J Abnorm Psychol. 2015 Nov;124(4):1003-13. doi: 10.1037/abn0000111. J Abnorm Psychol. 2015. PMID: 26595477 Free PMC article.
-
The role of dieting in binge eating disorder: etiology and treatment implications.Clin Psychol Rev. 1999 Jan;19(1):25-44. doi: 10.1016/s0272-7358(98)00009-9. Clin Psychol Rev. 1999. PMID: 9987582 Review.
-
Examining weight suppression as a transdiagnostic factor influencing illness trajectory in bulimic eating disorders.Physiol Behav. 2019 Sep 1;208:112565. doi: 10.1016/j.physbeh.2019.112565. Epub 2019 May 30. Physiol Behav. 2019. PMID: 31153878 Free PMC article. Review.
Cited by
-
The role of negative urgency and expectancies in problem drinking and disordered eating: testing a model of comorbidity in pathological and at-risk samples.Psychol Addict Behav. 2012 Mar;26(1):112-23. doi: 10.1037/a0023460. Epub 2011 May 23. Psychol Addict Behav. 2012. PMID: 21604832 Free PMC article.
-
Relationships between eating disorder-specific and transdiagnostic risk factors for binge eating: An integrative moderated mediation model of emotion regulation, anticipatory reward, and expectancy.Eat Behav. 2018 Dec;31:131-136. doi: 10.1016/j.eatbeh.2018.10.001. Epub 2018 Oct 17. Eat Behav. 2018. PMID: 30359908 Free PMC article.
-
The role of negative reinforcement eating expectancies in the relation between experiential avoidance and disinhibition.Eat Behav. 2016 Apr;21:129-34. doi: 10.1016/j.eatbeh.2016.01.003. Epub 2016 Jan 21. Eat Behav. 2016. PMID: 26854594 Free PMC article.
-
Distinctions Between Two Expectancies in the Prediction of Maladaptive Eating Behavior.Pers Individ Dif. 2011 Jan 1;50(1):25-30. doi: 10.1016/j.paid.2010.08.015. Pers Individ Dif. 2011. PMID: 21127719 Free PMC article.
-
Impulsivity-like traits and smoking behavior in college students.Addict Behav. 2010 Jul;35(7):700-5. doi: 10.1016/j.addbeh.2010.03.008. Epub 2010 Mar 12. Addict Behav. 2010. PMID: 20381971 Free PMC article.
References
-
- Alloy LB, Tabachnik N. Assessment of covariation by humans and animals: The joint influence of prior expectations and current situational information. Psychological Review. 1984;91:112–149. - PubMed
-
- Anderson KG, Smith GT, Fischer S. Women and acquired preparedness: Personality and learning implications for alcohol use. Journal of Studies on Alcohol. 2003;64:384–392. - PubMed
-
- Annus AM, Smith GT, Masters K. Manipulation of thinness and restricting expectancies: Further evidence for a causal role of thinness and restricting expectancies in the etiology of eating disorders. Psychology of Addictive Behaviors. 2008;22:278–287. - PubMed
-
- Attie I, Brooks-Gunn J. Development of eating problems in adolescent girls: A longitudinal study. Developmental Psychology. 1989;25:70–79.
-
- Barnow S, Shultz G, Lucht M, Ulrich I, Preuss UW, Freyberger HJ. Do alcohol expectancies and peer delinquency/substance use mediate the relationship between impulsivity and drinking behaviour in adolescence? Alcohol & Alcoholism. 2004;39:213–219. - PubMed
