. 2010 Nov;139(4):665-82.
doi: 10.1037/a0020198.

Decision making and the avoidance of cognitive demand

Affiliations

Decision making and the avoidance of cognitive demand

Wouter Kool et al. J Exp Psychol Gen. 2010 Nov.

Abstract

Behavioral and economic theories have long maintained that actions are chosen so as to minimize demands for exertion or work, a principle sometimes referred to as the law of less work. The data supporting this idea pertain almost entirely to demands for physical effort. However, the same minimization principle has often been assumed also to apply to cognitive demand. The authors set out to evaluate the validity of this assumption. In 6 behavioral experiments, participants chose freely between courses of action associated with different levels of demand for controlled information processing. Together, the results of these experiments revealed a bias in favor of the less demanding course of action. The bias was obtained across a range of choice settings and demand manipulations and was not wholly attributable to strategic avoidance of errors, minimization of time on task, or maximization of the rate of goal achievement. It is remarkable that the effect also did not depend on awareness of the demand manipulation. Consistent with a motivational account, avoidance of demand displayed sensitivity to task incentives and covaried with individual differences in the efficacy of executive control. The findings reported, together with convergent neuroscientific evidence, lend support to the idea that anticipated cognitive demand plays a significant role in behavioral decision making.


Figures

Figure 1
Figure 1
(a): Example of cues in the DST of Experiment 1. Cues appeared as decks of cards. Subjects used the keyboard to select one deck, causing it to reveal a blue or purple number. They then made a vocal response to the number. (b): Examples of cues in Experiment 2, which were depicted as striped or solid-colored balls. (c): Examples of cues in Experiments 3-5. Subjects were presented with 8 separate pairs of choice cues over the course of one session.
Figure 2
Figure 2
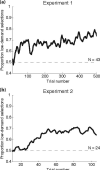
Ten-trial running average showing the proportion of choices from the low-demand alternative, across the span of the session, in Experiments 1 (panel a) and 2 (panel b). Timecourses begin at trial 10, the first point for which the running average exists.
Figure 3
Figure 3
(a): Distribution of individual subjects’ low-demand selection rates across Experiments 1 and 2 (n = 67). (b): Distribution of low-demand selection rates across Experiments 3, 4, and 5 (n = 72), in which each subject faced multiple pairs of choice cues. Experiment 3 includes two groups of subjects (see text). When testing involved multiple runs, no subject showed an extreme choice bias in favor of a higher-demand alternative.
Figure 4
Figure 4
Scatterplot of individual low-demand selection rates against switch cost (task switch RT – task repetition RT) in Experiment 5. Demand selection rates showed a significant positive correlation with switch costs (r = 0.54, p = 0.02).
Figure 5
Figure 5
Sequence of events in the fill/clear task. At the outset of each game, an 8 by 11 board appeared, with a random subset of pieces filled in either green or blue. Participants filled or cleared pieces, with the ultimate objective of either completely clearing or completely filling the board. In the current example, the participant presses the right key to fill four pieces at the outset of the game. As the color changes after this response, the participant presses the left key to fill four subsequent pieces. Next, a jump occurs and only four pieces remain on the board. The participant decides to switch strategies and clears all remaining pieces in the grid, thereby winning the game.
Figure 6
Figure 6
The fill proportions OPFi, JPFi,stay and JPFi,switch are plotted for all bin numbers i (one through seven). The overall pattern reveals that participants reasonably chose the fill strategy more often when the initial board state was nearer to full than nearer to empty. Post-jump strategy choice revealed that participants tended to maintain their established strategy, instead of switching to the other strategy. The shaded areas delineate the contrast JIP - OIP, as described in the text.
Figure 7
Figure 7
The differences between JPFstay and JPFswitch and the difference between JIP and OIP and their standard errors are given for the paid and unpaid groups of Experiments 6A and 6B. Both differences were significantly smaller for the paid group than for the unpaid group. * p < 0.05, ** p < 0.01

Similar articles

Cited by

References

    1. Allport GW. The nature of prejudice. Addison Wesley; New York: 1954.
    1. Anderson JR. The adaptive character of thought. Lawrence Erlbaum; Hillsdale, NJ: 1990.
    1. Arrington CM, Logan GD. The cost of a voluntary task switch. Psychological Science. 2004;15:610–615. - PubMed
    1. Ballard DH, Hayhoe MM, Pook PK, Rao RPN. Deictic codes for the embodiment of cognition. Behavioral and Brain Sciences. 1997;20:723–742. - PubMed
    1. Ballé M. La loi du moindre effort mental. Sciences Humaines. 2002;128:36–39.

Publication types