

Genotyping three SNPs affecting warfarin drug response by isothermal real-time HDA assays
- PMID: 20854800
- PMCID: PMC2991486
- DOI: 10.1016/j.cca.2010.09.014
Genotyping three SNPs affecting warfarin drug response by isothermal real-time HDA assays
Abstract
Background: The response to the anticoagulant drug warfarin is greatly affected by genetic polymorphisms in the VKORC1 and CYP2C9 genes. Genotyping these polymorphisms has been shown to be important in reducing the time of the trial and error process for finding the maintenance dose of warfarin thus reducing the risk of adverse effects of the drug.
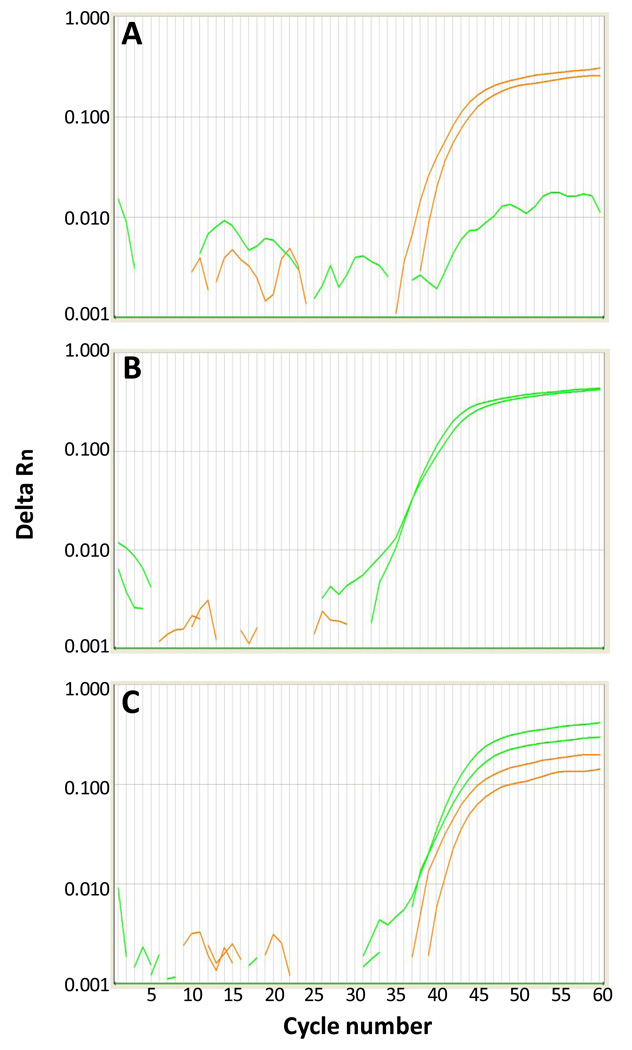
Method: We developed a real-time isothermal DNA amplification system for genotyping three single nucleotide polymorphisms (SNPs) that influence warfarin response. For each SNP, real-time isothermal Helicase Dependent Amplification (HDA) reactions were performed to amplify a DNA fragment containing the SNP. Amplicons were detected by fluorescently labeled allele specific probes during real-time HDA amplification.
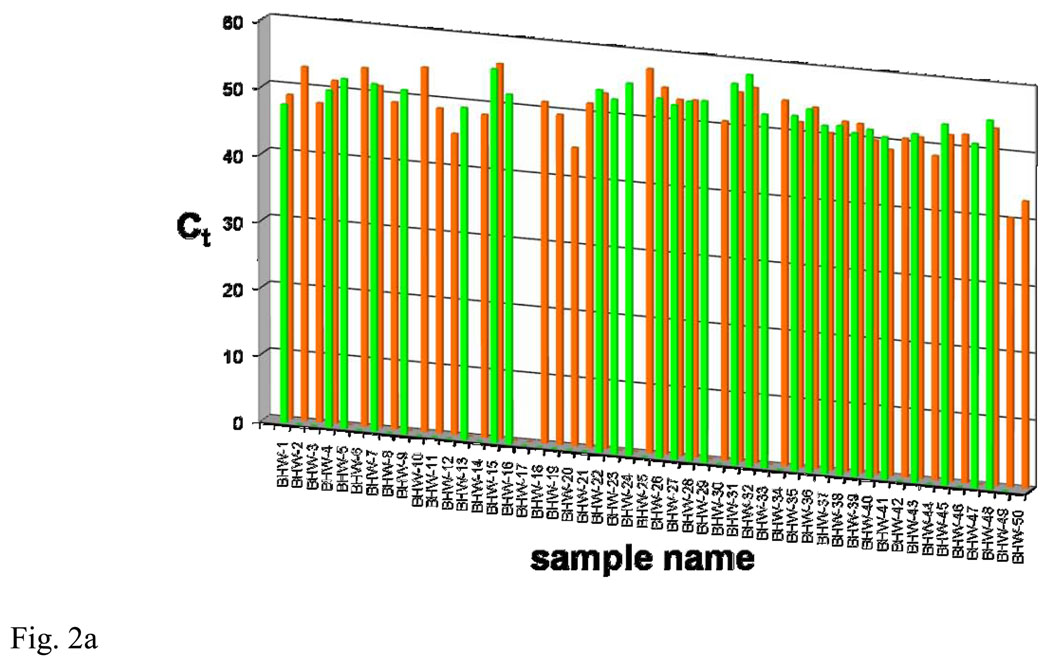
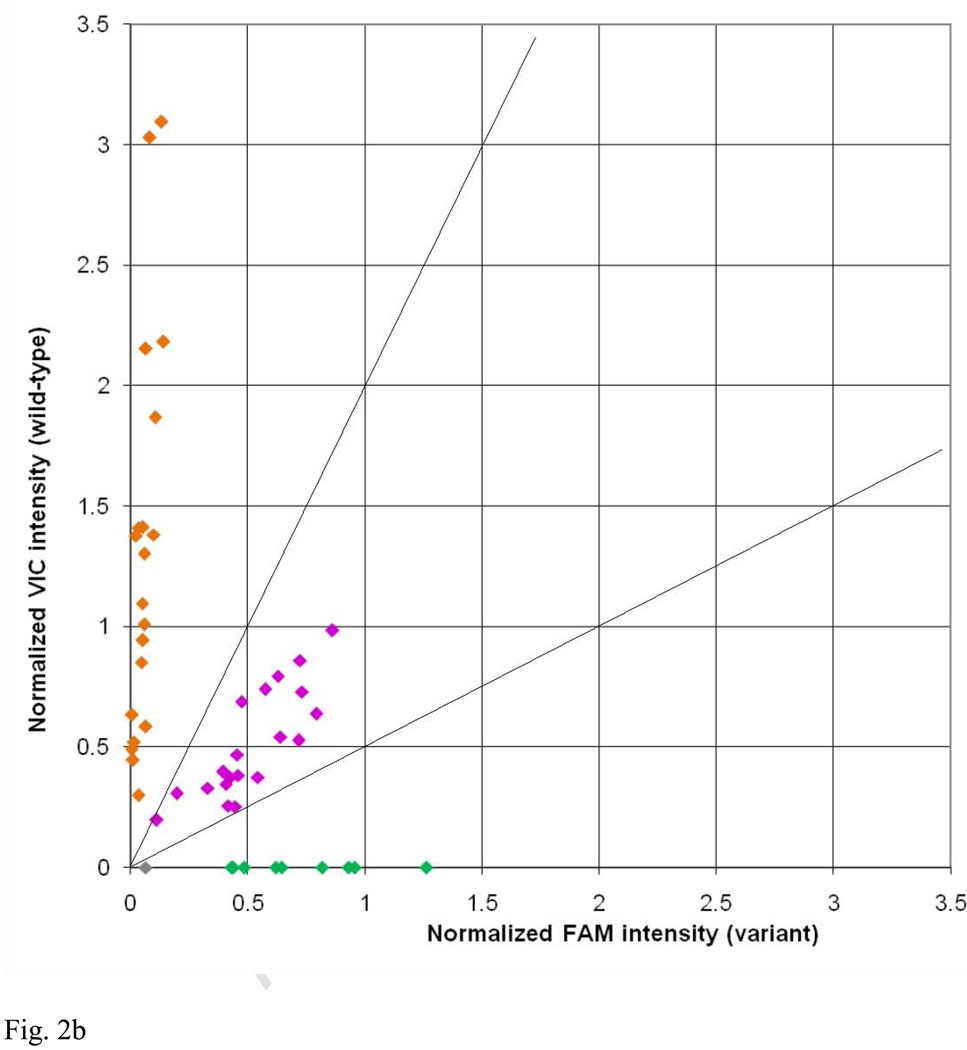
Results: Fifty clinical samples were analyzed by the HDA-based method, generating a total of 150 results. Of these, 148 were consistent between the HDA-based assays and a reference method. The two samples with unresolved HDA-based test results were repeated and found to be consistent with the reference method.
Conclusion: The HDA-based assays demonstrated a clinically acceptable performance for genotyping the VKORC1 -1639G>A SNP and two SNPs (430C>T and 1075A>C) for the CYP2C9 enzyme (CYP2C9*2 and CYP2C9*3), all of which are relevant in warfarin pharmacogenentics.
Copyright © 2010 Elsevier B.V. All rights reserved.
Figures
Similar articles
-
Rapid single-nucleotide polymorphism detection of cytochrome P450 (CYP2C9) and vitamin K epoxide reductase (VKORC1) genes for the warfarin dose adjustment by the SMart-amplification process version 2.Clin Chem. 2009 Apr;55(4):804-12. doi: 10.1373/clinchem.2008.115295. Epub 2009 Jan 30. Clin Chem. 2009. PMID: 19181737
-
Distribution of CYP2C9 and VKORC1 risk alleles for warfarin sensitivity and resistance in the Israeli population.Curr Drug Saf. 2010 Jul 2;5(3):190-3. doi: 10.2174/157488610791698299. Curr Drug Saf. 2010. PMID: 20210733
-
CYP2C9 and VKORC1 polymorphisms influence warfarin dose variability in patients on long-term anticoagulation.Eur J Clin Pharmacol. 2013 Apr;69(4):789-97. doi: 10.1007/s00228-012-1404-5. Epub 2012 Sep 19. Eur J Clin Pharmacol. 2013. PMID: 22990331 Clinical Trial.
-
Warfarin dose and the pharmacogenomics of CYP2C9 and VKORC1 - rationale and perspectives.Thromb Res. 2007;120(1):1-10. doi: 10.1016/j.thromres.2006.10.021. Epub 2006 Dec 11. Thromb Res. 2007. PMID: 17161452 Review.
-
Warfarin therapy: influence of pharmacogenetic and environmental factors on the anticoagulant response to warfarin.Vitam Horm. 2008;78:247-64. doi: 10.1016/S0083-6729(07)00012-X. Vitam Horm. 2008. PMID: 18374198 Review.
Cited by
-
Recent advances and challenges of biosensing in point-of-care molecular diagnosis.Sens Actuators B Chem. 2021 Dec 1;348:130708. doi: 10.1016/j.snb.2021.130708. Epub 2021 Sep 3. Sens Actuators B Chem. 2021. PMID: 34511726 Free PMC article. Review.
-
Advances in point-of-care genetic testing for personalized medicine applications.Biomicrofluidics. 2023 May 3;17(3):031501. doi: 10.1063/5.0143311. eCollection 2023 May. Biomicrofluidics. 2023. PMID: 37159750 Free PMC article. Review.
References
-
- Reynolds KK, Valdes R, Jr, Hartung BR, Linder MW. Individualizing warfarin therapy. Pers Med. 2007;4:11–31. - PubMed
-
- Ansell J, Hirsh J, Hylek E, Jacobson A, Crowther M, Palareti G. Pharmacology and management of the vitamin K antagonists: American College of Chest Physicians Evidence-Based Clinical Practice Guidelines. Chest. ((8th Edition)) 2008;133:160S–198S. - PubMed
-
- Baglin TP, Cousins D, Keeling DM, Perry DJ, Watson HG. Safety indicators for inpatient and outpatient oral anticoagulant care: [corrected] Recommendations from the British Committee for Standards in Haematology and National Patient Safety Agency. Br J Haematol. 2007;136:26–29. - PubMed
-
- Flockhart DA, O'Kane D, Williams MS, Watson MS, Gage B, Gandolfi R, et al. Pharmacogenetic testing of CYP2C9 and VKORC1 alleles for warfarin. Genet Med. 2008;10:139–150. - PubMed
-
- Husted SE, Ziegler BK, Kher A. Long-term anticoagulant therapy in patients with coronary artery disease. Eur Heart J. 2006;27:913–919. - PubMed
Publication types
MeSH terms
Substances
Grants and funding
LinkOut - more resources
Full Text Sources
Other Literature Sources
Medical
Research Materials
