

Detection of dysplasia in Barrett's esophagus with in vivo depth-resolved nuclear morphology measurements
- PMID: 20854820
- PMCID: PMC3008285
- DOI: 10.1053/j.gastro.2010.09.008
Detection of dysplasia in Barrett's esophagus with in vivo depth-resolved nuclear morphology measurements
Abstract
Background & aims: Patients with Barrett's esophagus (BE) show increased risk of developing esophageal adenocarcinoma and are routinely examined using upper endoscopy with biopsy to detect neoplastic changes. Angle-resolved low coherence interferometry (a/LCI) uses in vivo depth-resolved nuclear morphology measurements to detect dysplasia. We assessed the clinical utility of a/LCI in the endoscopic surveillance of patients with BE.
Methods: Consecutive patients undergoing routine surveillance upper endoscopy for BE were recruited at 2 endoscopy centers. A novel, endoscope-compatible a/LCI system measured the mean diameter and refractive index of cell nuclei in esophageal epithelium at 172 biopsy sites in 46 patients. At each site, an a/LCI measurement was correlated with a concurrent endoscopic biopsy specimen. Each biopsy specimen was assessed histologically and classified as normal, nondysplastic BE, indeterminate for dysplasia, low-grade dysplasia (LGD), or high-grade dysplasia (HGD). The a/LCI data from multiple depths were analyzed to evaluate its ability to differentiate dysplastic from nondysplastic tissue.
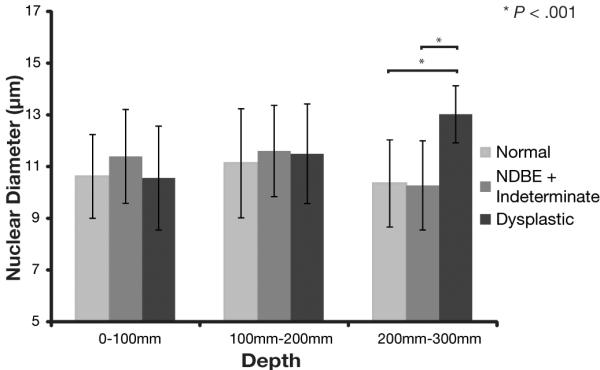
Results: Pathology characterized 5 of the scanned sites as HGD, 8 as LGD, 75 as nondysplastic BE, 70 as normal tissue types, and 14 as indeterminate for dysplasia. The a/LCI nuclear size measurements separated dysplastic from nondysplastic tissue at a statistically significant (P < .001) level for the tissue segment 200 to 300 μm beneath the surface with an accuracy of 86% (147/172). A receiver operator characteristic analysis indicated an area under the curve of 0.91, and an optimized decision point gave 100% (13/13) sensitivity and 84% (134/159) specificity.
Conclusions: These preliminary data suggest a/LCI is accurate in detecting dysplasia in vivo in patients with BE.
Copyright © 2011 AGA Institute. Published by Elsevier Inc. All rights reserved.
Figures


References
-
- Jemal A, Siegel R, Ward E, et al. Cancer statistics, 2009. CA: A Cancer Journal for Clinicians. 2009;59:225. - PubMed
-
- Spechler SJ, Goyal RK. The columnar-lined esophagus, intestinal metaplasia, and Norman Barrett. Gastroenterology. 1996;110:614–21. - PubMed
-
- Spechler S. Barrett’s esophagus. 2006 GI Motility online. - PubMed
-
- Shaheen NJ, Richter JE. Barrett’s oesophagus. Lancet. 2009;373:850–61. - PubMed
-
- Yousef F, Cardwell C, Cantwell M, et al. The incidence of esophageal cancer and high-grade dysplasia in Barrett’s esophagus: a systematic review and meta-analysis. American Journal of Epidemiology. 2008 - PubMed
Publication types
MeSH terms
Grants and funding
LinkOut - more resources
Full Text Sources
Other Literature Sources
Medical
