Comparative Study
. 2010 Nov 15;588(Pt 22):4365-85.
doi: 10.1113/jphysiol.2010.198564. Epub 2010 Sep 20.

Maturation of synaptic partners: functional phenotype and synaptic organization tuned in synchrony

Affiliations
Comparative Study

Maturation of synaptic partners: functional phenotype and synaptic organization tuned in synchrony

Brian K Hoffpauir et al. J Physiol. .

Abstract

Maturation of principal neurons of the medial nucleus of the trapezoid body (MNTB) was assessed in the context of the developmental organization and activity of their presynaptic afferents, which grow rapidly to form calyces of Held and to establish mono-innervation between postnatal days (P)2 and 4. MNTB neurons and their inputs were studied from embryonic day (E)17, when the nucleus was first discernable, until P14 after the onset of hearing. Using a novel slice preparation containing portions of the cochlea, cochlear nucleus and MNTB, we determined that synaptic inputs form onto MNTB neurons at E17 and stimulation of the cochlear nucleus can evoke action potentials (APs) and Ca(2+) signals. We analysed converging inputs onto individual MNTB neurons and found that competition among inputs was resolved quickly, as a single large input, typically larger than 4 nA, emerged from P3-P4. During calyx growth but before hearing onset, MNTB cells acquired their mature, phasic firing property and quantitative real-time PCR confirmed a coincident increase in low threshold K(+) channel mRNA. These events occurred in concert with an increase in somatic surface area and a 7-fold increase in the current threshold (30 to >200 pA) required to evoke action potentials, as input resistance (R(in)) settled from embryonic values greater than 1 GΩ to approximately 200 MΩ. We postulate that the postsynaptic transition from hyperexcitability to decreased excitability during calyx growth could provide a mechanism to establish the mature 1:1 innervation by selecting the winning calyceal input based on synaptic strength. By comparing biophysical maturation of the postsynaptic cell to alterations in presynaptic organization, we propose that maturation of synaptic partners is coordinated by synaptic activity in a process that is likely to generalize to other neural systems.


Figures
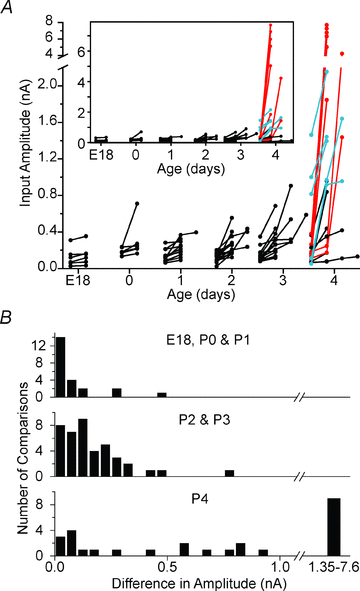
Figure 6
Figure 6. Single calyces of Held emerge from multiple converging inputs
A, inputs to the same cell are linked by lines and arranged by increasing amplitude from left to right. The EPSC amplitudes of individual inputs are plotted only for cells with multiple (2–4) inputs at each age. For P4, cells with large inputs that differ from other converging inputs by more than 1 nA are shown in red, and cells with intermediate sized inputs that differ by less than 0.75 nA are shown in blue. P4 cells with only small amplitude EPSCs (<0.5 nA) are shown in black. Note the data are plotted to different scales above and below the broken y-axis. Data are plotted with an unbroken y-axis in the inset to illustrate EPSC amplitude differences from P3–P4. Sample size (n) at each age: E18 (6), P0 (6), P1 (10), P2 (11), P3 (10), P4 (20). B, the differences between larger and the smallest inputs become more pronounced as calyces begin to grow at P2. For cells with more than 2 inputs, each larger input was subtracted from the smallest input such that cells with 3 or 4 inputs account for 2 or 3 comparisons, respectively.
Figure 1
Figure 1. Progressive appearance of MNTB at embryonic ages
A, the MNTB is not discernable in tissue slices (∼250 μm in thickness) prepared from E16 mice. Clusters of neurons (lighter regions indicated by arrowheads) can be seen in the region of the developing superior olivary complex in this DIC image, but the MNTB is not discernable. Black arrowheads point to the most medial group of cells that could be presumptive MNTB neurons. Scale bar in A also applies to panel C. Orientation shown by vertical (dorsal) and horizontal (lateral) arrows placed near the midline. B, Nissl stained slice from E16.5 animal shows neurons populating mostly the lateral portion of territory of the MNTB (arrow points to developing cell group on each side of brain), suggesting nucleus formation begins around this time. Scale bar in B also applies to panel D. C, neurons populate the appropriate region of the MNTB and can be easily discerned with DIC optics. D, Nissl stained slices at E17.5 reveal the medial, ventral, and dorsal boundaries of the MNTB. All recordings were made from the medial half of the nucleus to assure all cells were located in the MNTB. The brain was removed from the skull in A (E16) prior to slicing, but all other images show whole-head slice preparations.
Figure 2
Figure 2. MNTB neurons are innervated at E17
A, whole-head slice preparation containing portions of the cochleae, VCN and MNTB from E17 embryo. B, VCN stimulation evoked Ca2+ responses in MNTB neurons. Cells were loaded with the ratiometric Ca2+ indicator, Fura-2. Pixel intensities represent background subtracted ratio values collected with excitation light at 340 nm and 380 nm (F340/F380). Image levels were adjusted to minimize background. Thermal scale, with warmer colours corresponding to higher intracellular Ca2+, shows stimulation effects at two stimulus amplitudes (ii and iii). MNTB cells have low resting Ca2+ levels and were easily discerned (frame i, shown with and without thermal scale). C, ratiometric Ca2+ signals from four cells in panel B. Responses were evoked by graded stimulation (5 V increments indicated above traces). Timing of i–iii from panel B indicated above trace 3. D, recordings from an E17 MNTB neuron show responses to VCN stimulation. Single stimulation pulses were delivered as indicated by the arrows, and all recordings were made from the same neuron. Top row shows extracellular, cell-attached recordings that were made prior to rupturing the membrane in voltage clamp. Middle row shows examples of whole cell voltage clamp recordings. Bottom row shows whole cell current clamp recordings. Single action potentials were noted at lower stimulus amplitudes (<10 V) and multiple action potentials were observed at higher stimulus voltages (>10 V) in both cell-attached and current clamp recordings. A low spontaneous rate was observed below threshold (left column, also panel C) indicating that stimulation of the VCN was responsible for the multiple peaks in voltage clamp and the prolonged excitatory postsynaptic potentials in current clamp. Scale bars apply to all three traces across rows.
Figure 5
Figure 5. MNTB neurons are innervated by multiple inputs before calyx growth
A–B, stimulation of inputs evoked Ca2+ responses in MNTB neurons loaded with Fura-2. Ratiometric fluorescence values (F340/F380) are plotted for four representative cells from E18 (panel A) and P2 (panel B) animals. Graded stimulation (3V increments indicated above traces) was applied to all cells. Cells with signatures of multiple inputs are denoted with asterisks. C and D, representative voltage clamp recordings from individual cells show graded EPSCs evoked during minimal stimulation protocols. Stimulus values are indicated on each trace. E–F, plots of peak amplitude of stimulus evoked EPSCs highlights the graded response to varying levels of stimulation at E18 (panel E) and P2 (panel F), which is indicative of recruitment of multiple inputs. Open circles denote individual traces shown in C and D. Four runs of randomized stimulus pulses were applied to each cell. Average values for each input are indicated by horizontal grey lines. G, most MNTB neurons innervated by multiple inputs from E18–P2. Numbers above columns denote sample size.
Figure 3
Figure 3. Glutamatergic and GABAergic inputs innervate MNTB neurons prior to calyx growth
A, voltage clamp recordings of spontaneous EPSCs recorded from a P0 MNTB neuron. Asterisks denote GABAergic events with slower decay rates that were unaffected by strychnine (2 μm) but blocked by GABAzine (10 μm). Glutamatergic currents with faster decay rates were blocked by bath application of CNQX (10 μm; holding potential = −83 mV). Drugs were applied cumulatively. B, average waveforms of glutamatergic and GABAergic spontaneous synaptic currents recorded from an E17 MNTB neuron. Decay time constants for exponential fits (grey lines) from this neuron are shown. C, average amplitude, inter-event interval, and decay time constants are plotted for spontaneous synaptic currents recorded from E17–P0 MNTB neurons. Data are averaged from a total of 7 neurons at E17 (3), E18 (2) and P0 (2).
Figure 4
Figure 4. Immature calyces form after rapid period of calyx growth from P2 to P4
A–C, maximal projections of confocal image series show fluorescently labelled axons in the MNTB. Individual terminals were pseudo-coloured (red or green) prior to composing the projection to highlight their morphologic extent (left panels). Isolated terminals were reconstructed and are depicted alone following 3-dimensional rendering of their structure to reveal depth related features (right panels). Terminals were revealed with fluorescent dextrans by electroporating axons as they crossed the midline. At P1 (panel A) afferent terminals within the MNTB have processes which are thin and highly branched with many fine filopodia-like extensions. A single large ‘protocalyx’ first appears among P2 MNTB afferents (arrows in panel B). At P4 (panel C) the immature calyx has appeared (arrow) with an extension to a large ending that may contact another cell (arrowheads). Scale bar in A applies to all confocal projections.
Figure 7
Figure 7. MNTB neurons acquired phasic phenotype during calyx growth as the RMP reached mature values
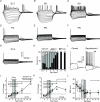
A–G, representative current clamp recordings from MNTB neurons at ages E17, P0, P2, P4, P6, P8 and P14. Data were recorded at RMP and shown as a −70 pA step with successive steps at 10 pA increments. Intervening steps are omitted for clarity. H, MNTB cells became phasic (black bars) in parallel with calyx growth. The percentage of cells that fired tonically (grey bars) increased from E17 to P1 and then decreased at older ages. Some cells at the youngest ages failed to fire any APs (white bars). Horizontal arrow indicates period of calyx growth, after which ∼85% of MNTB neurons are mono-innervated at P4. Numbers above bars indicate sample size. I, blocking low-threshold K+ (KLT) channels with dendrotoxin-I (100 nm) can transform a cell with a phasic phenotype into a tonically firing cell. Traces recorded from a P3 MNTB neuron correspond to −50 and +100 pA current injections. The asterisk denotes the emergence of after-hyperpolarization induced action potentials when KLT channels are blocked. J and K, gene expression profiles correlate with biophysical maturation of MNTB neurons. Quantitative real-time PCR of un-amplified RNA indicated that relative mRNA profiles of KLT channels, Kcna1 and Kcna2, correlate with biophysical maturation of MNTB neurons. The fold change for each gene, relative to the average value at P0.5, is plotted for individual samples (open circles). Average values (small filled circles) are connected by lines. The 2-fold threshold is denoted by the horizontal dashed line. Fold changes across all ages were significant (P < 0.0002; Kruskall–Wallis ANOVA). Fisher's least significant difference test was utilized to compare differences between ages, and significant differences (P < 0.05) are indicated by horizontal lines above. Each age denoted by the square differs significantly from ages denoted by vertical bars. Kcna1 mRNA levels from P2.5–P5.5 did not differ from each other, but were significantly different from E18.5, P0.5, P8.5 and P14.5. L, the RMP became more hyperpolarized as MNTB neurons matured. The continuous line denotes the Boltzmann equation that was fit to the data (fit parameters are given in Supplemental Table 2) with the age of half-maturation of 0.33 days (dotted vertical line). Sample size (n) for RMP data: E17 (16), E18 (18), P0 (26), P1 (17), P2 (23), P3 (16), P4 (11), P5 (11), P6 (19), P8 (20), P14 (19).
Figure 8
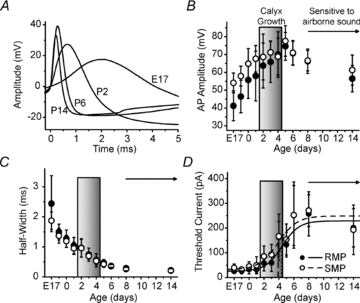
Figure 8. Maturation of action potential waveforms in MNTB neurons
A, representative AP waveforms recorded at RMP are aligned at inflection points. B, AP amplitudes increased until P5, then decreased through P14. Amplitudes were measured from baseline (RMP, open circles; SMP, open circles) to peak. C, AP half-widths decreased exponentially with age. Values obtained at RMP were significantly different from those measured at SMP from E17 to P0 (P < 0.02 for each age). D, threshold current increased in parallel with calyx growth. Cells that were held at SMP at E17–P3 had larger threshold current values than cells held at RMP (filled circles). Boltzmann equations fitted to data recorded at RMP and SMP are shown as continuous and dashed lines, respectively. Ages of half-maturation are indicated by vertical dotted (RMP) and dashed (SMP) lines. Additional fit parameters can be found in Supplemental Table 2. Sample sizes (n) for data in B–D: RMP = E17 (14), E18 (15), P0 (23), P1 (15), P2 (23), P3 (16), P4 (11), P5 (11), P6 (19), P8 (20), P14 (19); SMP = E17 (12), E18 (16), P0 (16), P1 (10), P2 (15), P3 (13), P4 (9), P5 (8), P6 (12), P8 (12), P14 (10).
Figure 9
Figure 9. Input resistance values decreased prior to and during calyx growth
A and B, RSlope values are plotted as a function of voltage and time for all current steps for representative E17 and P6 neurons. Continuous black lines on the floor projections indicate the RMP. Continuous vertical lines fall from the Rin, measured at RMP at 190 ms latency. Dashed vertical lines fall from the greatest RSlope value (RSlope-Peak). C, Rin values measured from recordings at the RMP (black filled circles) and SMP (open circles) and values of RSlope-Peak (red circles) decreased from the earliest ages studied. Continuous red line corresponds to Boltzmann fit of RSlope-Peak data with age of half-maturation denoted by the dotted vertical line. D, RSlope-Peak occurred closer to the current onset in older animals. RSlope-Peak latencies for many cells between E17 and P0 appeared to be limited by the duration of the current steps (200 ms). E, membrane potentials of RSlope-Peak were subtracted from the RMP, and the mean difference is plotted for each age. The voltage of greatest cell resistance is tuned to the RMP (difference = 0) at the onset of calyx growth at P2. F, somatic surface area of MNTB neurons increased from P0 to P4. Cell perimeters were measured from neurons (n = 20 for each age) located in the medial half of the MNTB on semi-thin (2 μm thick) sections. Sample size (n) for Rin at RMP and SMP, respectively: E17 (16, 14), E18 (18, 17), P0 (26, 16), P1 (17, 10), P2 (23, 15), P3 (16, 13), P4 (11, 9), P5(11, 8), P6 (19, 12), P8 (20, 11), P14 (19, 10). Sample size (n) for RSlope-Peak data in C–E: E17 (16), E18 (18), P0 (23), P1 (13), P2 (20), P3 (16), P4 (11), P5 (11), P6 (19), P8 (20), P14 (19).
Figure 10
Figure 10. Small inputs drive MNTB neurons prior to calyx growth
A, the percentage of cells with APs that could be evoked by activation of the smallest amplitude input is shown for each age. Only AP-competent cells with multiple inputs were included in these analyses. B, spontaneous synaptic events evoked APs in an E18 MNTB neuron at RMP (top). No APs were recorded when the cell was held near the SMP (bottom).
Figure 11
Figure 11. MNTB neurons mature in synchrony with calyx growth before the onset of hearing
Boltzmann fits (Supplemental Table 2) to individual parameters are normalized and shown at the top; thick lines correspond to changes between 10 and 90%, and circles indicate ages of half-maturation. The tuning of RSlope-Peak was not fitted with a Boltzmann equation. Two temporal patterns of maturation are indicated: (i) events that began and were essentially complete prior to calyx formation, and (ii) events that matured in parallel with calyx growth. Changes in gene expression for Kcna2 and Kcna1 are shown in green, with shading density corresponding to fold-changes that were measured relative to levels at birth. Black arrow on bottom denotes onset of sensitivity to airborne sound. Period of calyx growth extends to P4 when ∼85% of cells are mono-innervated; completion of this process may extend another 1–2 days. Dashed vertical lines (E17, P14) indicate the temporal window of this study. Developmental milestones of mouse auditory circuit including hair cells, spiral ganglion cells (SGCs), VCN neurons and MNTB neurons are depicted on the left. Dates of neurogenesis are shown in blue. Connected open circles denote confirmed synaptic connections between nuclei. Our data showing a functional connection of VCN to MNTB are shown in cyan. References: 1, Pierce (1973); 2, Martin & Rickets (1981); 3, Pierce (1967); 4, Maklad & Fritzsch (2003); 5, Ruben (1967); 6, Koundakjian et al. (2007); 7, Howell et al. (2007).

Comment in

Similar articles

Cited by

References

    1. Awatramani GB, Turecek R, Trussell LO. Staggered development of GABAergic and glycinergic transmission in the MNTB. J Neurophysiol. 2005;93:819–828. - PubMed
    1. Banks M, Smith P. Intracellular recordings from neurobiotin-labeled cells in brain slices of the rat medial nucleus of the trapezoid body. J Neurosci. 1992;12:2819–2837. - PMC - PubMed
    1. Beutner D, Moser T. The presynaptic function of mouse cochlear inner hair cells during development of hearing. J Neurosci. 2001;21:4593–4599. - PMC - PubMed
    1. Bewick GS, Reid B, Jawaid S, Hatcher T, Shanley L. Postnatal emergence of mature release properties in terminals of rat fast- and slow-twitch muscles. Eur J Neurosci. 2004;19:2967–2976. - PubMed
    1. Brandt A, Striessnig J, Moser T. CaV1.3 channels are essential for development and presynaptic activity of cochlear inner hair cells. J Neurosci. 2003;23:10832–10840. - PMC - PubMed

Publication types