Comparative Study
. 2010 Dec;78(6):1124-34.
doi: 10.1124/mol.110.066332. Epub 2010 Sep 20.

The tarantula toxins ProTx-II and huwentoxin-IV differentially interact with human Nav1.7 voltage sensors to inhibit channel activation and inactivation

Affiliations
Comparative Study

The tarantula toxins ProTx-II and huwentoxin-IV differentially interact with human Nav1.7 voltage sensors to inhibit channel activation and inactivation

Yucheng Xiao et al. Mol Pharmacol. 2010 Dec.

Abstract

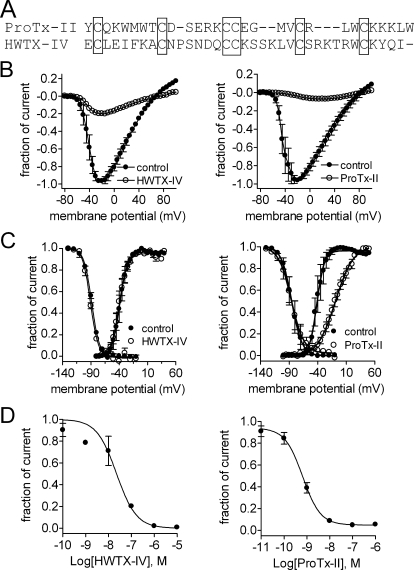
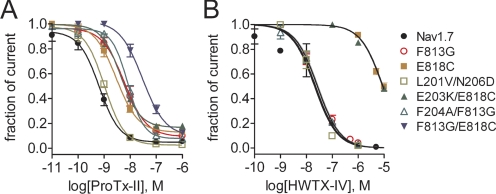
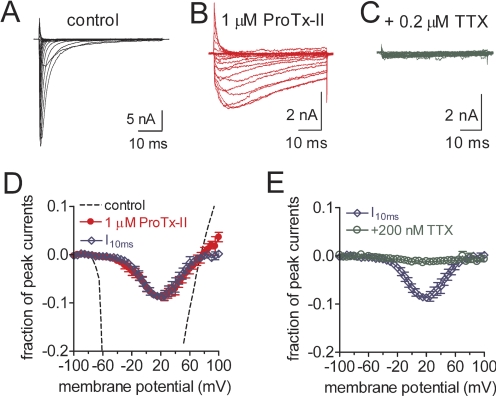
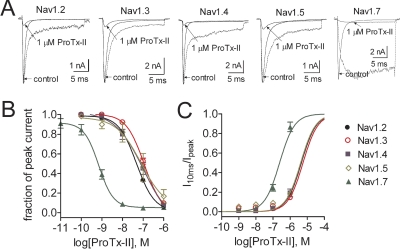
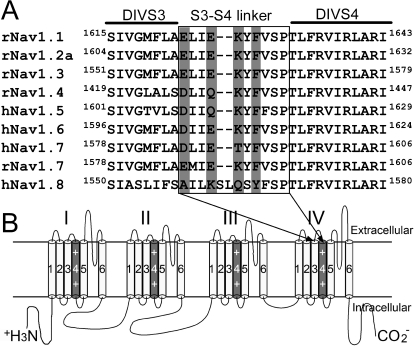
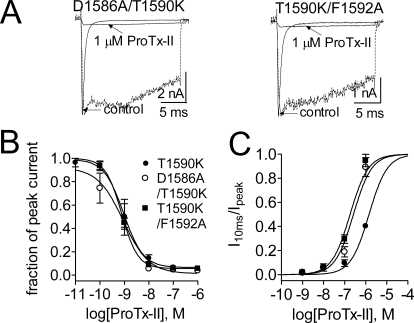
The voltage-gated sodium channel Na(v)1.7 plays a crucial role in pain, and drugs that inhibit hNa(v)1.7 may have tremendous therapeutic potential. ProTx-II and huwentoxin-IV (HWTX-IV), cystine knot peptides from tarantula venoms, preferentially block hNa(v)1.7. Understanding the interactions of these toxins with sodium channels could aid the development of novel pain therapeutics. Whereas both ProTx-II and HWTX-IV have been proposed to preferentially block hNa(v)1.7 activation by trapping the domain II voltage-sensor in the resting configuration, we show that specific residues in the voltage-sensor paddle of domain II play substantially different roles in determining the affinities of these toxins to hNa(v)1.7. The mutation E818C increases ProTx-II's and HWTX-IV's IC(50) for block of hNa(v)1.7 currents by 4- and 400-fold, respectively. In contrast, the mutation F813G decreases ProTx-II affinity by 9-fold but has no effect on HWTX-IV affinity. It is noteworthy that we also show that ProTx-II, but not HWTX-IV, preferentially interacts with hNa(v)1.7 to impede fast inactivation by trapping the domain IV voltage-sensor in the resting configuration. Mutations E1589Q and T1590K in domain IV each decreased ProTx-II's IC(50) for impairment of fast inactivation by ~6-fold. In contrast mutations D1586A and F1592A in domain-IV increased ProTx-II's IC(50) for impairment of fast inactivation by ~4-fold. Our results show that whereas ProTx-II and HWTX-IV binding determinants on domain-II may overlap, domain II plays a much more crucial role for HWTX-IV, and contrary to what has been proposed to be a guiding principle of sodium channel pharmacology, molecules do not have to exclusively target the domain IV voltage-sensor to influence sodium channel inactivation.


Figures

Fig. 1.
Fig. 1.
Effects of ProTx-II and HWTX-IV on WT Nav1.7 expressed in HEK293 cells. A, sequence alignment of ProTx-II and HWTX-IV. Six conserved cysteines are identified by the encompassing rectangles in the sequence alignment. B, differential effects of two toxins on the current-voltage relationships of WT Nav1.7. Cells were held at −100 mV. Nav1.7 currents were elicited by 50-ms depolarization steps to various voltages ranging from −80 to +100 mV in 5-mV increments. Currents elicited before and after application of 100 nM ProTx-II (left) or 100 nM HWTX-IV (right) were normalized to the maximum amplitude of control peak current. C, effects of the two toxins on normalized steady-state activation and inactivation of WT Nav1.7. Channel conductances before and after application of 100 nM ProTx-II or 100 nM HWTX-IV were calculated with the equation: G(V) = I/(VVrev), in which I, V, and Vrev represented inward current elicited as described in B, test potential, and reversal potential, respectively. Data are plotted as a fraction of the maximum conductance. The voltage-dependence of steady-state inactivation was estimated using a standard double-pulse protocol, in which a 20-ms depolarizing test potential of 0 mV followed a 500-ms prepulse at potentials that ranged from −130 to −10 mV with a 10-mV increment. Cells were held at −100 mV. All curves were fit with the Boltzmann equation as described under Materials and Methods. D, concentration-dependent inhibition of WT Nav1.7 by two toxins. Data points (mean ± S.E., each from three to four cells) were fit with the Hill equation as described under Materials and Methods. The values of IC50, slope factor (nH), and fbottom yielded are shown in Tables 1 and 2.
Fig. 2.
Fig. 2.
Concentration-response inhibitory curves of ProTx-II (A) and HWTX-IV (B) on DI and DII mutant Nav1.7 channels. Sodium current was induced at 5-s intervals by a 20-ms depolarization from a holding potential of −100 mV. The test pulse potentials to activate channels were set to −10 mV (WT and L201V/N206D), −5 mV (F204A/F813G, F204A/F813G, F813G, E1589Q), 0 mV (E818C and F813G/E818C), and +10 mV (E203K/E818C), respectively. The residual current after toxin treatment was plotted as fraction of the control current. Data points (mean ± S.E., each from 3 - 7 cells) were fit with a Hill equation as described under Materials and Methods. The values of IC50, slope factor (nH), and fbottom yielded are shown in Table 1 and 2.
Fig. 3.
Fig. 3.
ProTx-II significantly impeded fast inactivation of WT Nav1.7 expressed in HEK293 cells. Cells were held at −100 mV. Families of current traces before (A) and after application of 1 μM ProTx-II (B) or 200 nM TTX (C) were induced by 50-ms depolarizing steps to various potentials ranging from −100 to +100 mV in 5-mV increments. D and E, effects of 1 μM ProTx-II (D) or 200 nM TTX (E) on the current voltage (I-V) relationship of WT Nav1.7. All currents induced before and after toxin treatment were plotted as fraction of the maximum amplitude of control peak current. The dotted line indicates the control I-V curve. The red filled circles indicate the peak I-V curves after application of 1 μM ProTx-II. I10ms (blue open diamond) was shown as the current inactivated at 10 ms after application of 1 μM ProTx-II. E, effects of 200 nM TTX on the current-voltage (I-V) relationship of WT Nav1.7 sustained currents induced by ProTx-II. All currents induced before and after toxin treatment were plotted as fraction of the maximum amplitude of control peak current. The dotted line indicates the control I-V curve. The green open circles indicate the I-V curve after application of 200 nM TTX. I10ms (blue open diamond) was shown as the current inactivated at 10 ms after application of 1 μM ProTx-II.
Fig. 4.
Fig. 4.
ProTx-II differentially inhibited both activation and inactivation of sodium channel subtypes expressed in HEK293 cells. Cells were held at −100 mV. A, currents through WT Nav1.2, Nav1.3, Nav1.4 and Nav1.7 were induced by a 20-ms depolarizing potential of −10 mV. Nav1.5 current was elicited at −30 mV. The dotted lines show the residual current in the presence of 1 μM ProTx-II after normalization to the maximum amplitude of control current. B, concentration-response inhibitory curves of ProTx-II on the activation of five sodium channel subtypes (Nav1.2, Nav1.3, Nav1.4, Nav1.5, and Nav1.7). The residual current after ProTx-II treatment was plotted as a fraction of control current. Data points (mean ± S.E., each from three to seven cells) were fit with Hill equation as described under Materials and Methods. The IC50 values were estimated to be 52.9 ± 1.1 (Nav1.2a), 109.9 ± 7.1 (Nav1.3), 107.6 ± 7.7 (Nav1.4), and 79.4 ± 40.7 (Nav1.5) nM, respectively. The slope factor (nH) ranged from 0.9 to 1.1. C, concentration-response inhibitory curves of ProTx-II on the fast inactivation of five sodium channel subtypes. The I10ms was plotted as a fraction of the residual current after ProTx-II treatment. Inhibition of fast-inactivation increases the ratio of I10ms/Ipeak. Data points (mean ± S.E., each from three to seven cells) were fit with Hill equation as described under Materials and Methods. The IC50 values are shown in Supplementary Table 2.
Fig. 5.
Fig. 5.
Amino acid sequence alignment of the DIV S3–S4 linkers of seven α subunit isoforms from human. A, crucial determinants of neurotoxin receptor 3 are located in the S3–S4 linker of sodium channel domain II. The positions of amino acid residues of interest are shaded in gray. B, schematic diagram of sodium channel α subunit. The voltage sensor (the fourth segment) of each domain is shaded in gray and marked with “++.” The amino acid sequence of DIV S3–S4 linker is shown in the square frame of A as indicated by arrows.
Fig. 6.
Fig. 6.
Mutations in DIV S3–S4 linker differentially alter the effect of ProTx-II on fast-inactivation of hNav1.7 channels expressed in HEK293 cells. A, representative current traces for five mutant (D1586A, D1586E, E1589Q, T1590K, and F1592A) hNav1.7 channels. The test pulse potential was −10 mV (D1586A and D1586E) and −5 mV (E1589Q, T1590K and F1592A), respectively. Cells were held at −100 mV. The dotted line shows the residual current in the presence of 0.1 or 1 μM ProTx-II after normalization to the maximum amplitude of control current. B, concentration-response inhibitory curves of ProTx-II on the activation of WT and five mutant (D1586A, D1586E, E1589Q, T1590K, and F1592A) Nav1.7 channels. Residual current after toxin treatment was plotted as a fraction of control peak current amplitude. Data points (mean ± S.E., each from three to six cells) were fitted with Hill equation as described under Materials and Methods. The calculated values of IC50, slope factor (nH), and fbottom are shown in Table 1. C, concentration-response inhibitory curves of ProTx-II on fast inactivation of WT and five mutant (D1586A, D1586E, E1589Q, T1590K, and F1592A) Nav1.7 channels. The I10ms was plotted as a fraction of the residual current after ProTx-II treatment. Data points (mean ± S.E., each from three to six cells) were fitted with the Hill equation as described under Materials and Methods.
Fig. 7.
Fig. 7.
Two mutations (D1586A and F1592A) enhanced the ProTx-II slowing fast inactivation of hNav1.7 in the presence of K1590. A, representative current traces for two double mutant (D1586A/T1590K and T1590K/F1592A) hNav1.7 channels. The test pulse potential was −5 mV for D1586A/T1590K and 0 mV for T1590K/F1592A, respectively. Cells were held at −100 mV. The dotted lines show the residual current in the presence of 1 μM ProTx-II after normalization to the maximum amplitude of control current. B, concentration-response inhibitory curves of ProTx-II on the activation of three mutant (T1590K, D1586A/T1590K, and T1590K/F1592A) Nav1.7 channels. Residual current after toxin treatment was plotted as a fraction of control peak current amplitude. The calculated values of IC50, slope factor (nH), and fbottom are shown in Table 1. C, concentration-response inhibitory curves of ProTx-II on fast-inactivation of three mutant (T1590K, D1586A/T1590K, and T1590K/F1592A) Nav1.7 channels. The I10ms was plotted as a fraction of the residual current after ProTx-II treatment. The IC50 values are shown in Supplementary Table 2. In B and C, data points (mean ± S.E., each from three to four cells) were fitted with a Hill equation as described under Materials and Methods.

References

    1. Bendahhou S, Cummins TR, Kwiecinski H, Waxman SG, Ptácek LJ. (1999) Characterization of a new sodium channel mutation at arginine 1448 associated with moderate Paramyotonia congenita in humans. J Physiol 518:337–344 - PMC - PubMed
    1. Bosmans F, Martin-Eauclaire MF, Swartz KJ. (2008) Deconstructing voltage sensor function and pharmacology in sodium channels. Nature 456:202–208 - PMC - PubMed
    1. Catterall WA, Goldin AL, Waxman SGInternational Union of Pharmacology (2003) International Union of Pharmacology. XXXIX. Compendium of voltage-gated ion channels: sodium channels. Pharmacol Rev 55:575–578 - PubMed
    1. Cestèle S, Catterall WA. (2000) Molecular mechanisms of neurotoxin action on voltage-gated sodium channels. Biochimie 82:883–892 - PubMed
    1. Cestèle S, Scheuer T, Mantegazza M, Rochat H, Catterall WA. (2001) Neutralization of gating charges in domain II of the sodium channel alpha subunit enhances voltage-sensor trapping by a beta-scorpion toxin. J Gen Physiol 118:291–302 - PMC - PubMed

Publication types