

doi: 10.1128/AAC.00840-10.
Epub 2010 Sep 20.
Molecular characterization of off-target activities of telithromycin: a potential role for nicotinic acetylcholine receptors
Affiliations
- PMID: 20855733
- PMCID: PMC2981250
- DOI: 10.1128/AAC.00840-10
Item in Clipboard
Molecular characterization of off-target activities of telithromycin: a potential role for nicotinic acetylcholine receptors
Antimicrob Agents Chemother.
2010 Dec.
Abstract
Adverse effects have limited the clinical use of telithromycin. Preferential inhibition of the nicotinic acetylcholine receptors (nAChR) at the neuromuscular junction (α3β2 and NMJ), the ciliary ganglion of the eye (α3β4 and α7), and the vagus nerve innervating the liver (α7) could account for the exacerbation of myasthenia gravis, the visual disturbance, and the liver failure seen with telithromycin use. The studies presented here enable the prediction of expected side effects of macrolides in development, such as solithromycin (CEM-101).
Figures
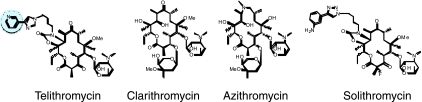
Chemical structures of the macrolides tested at the human nAChRs. The pyridine moiety of telithromycin has been highlighted for clarity.
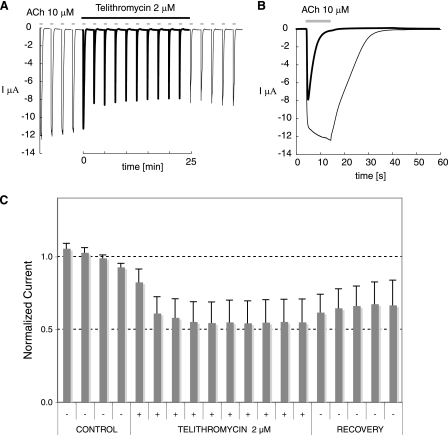
Telithromycin inhibits the muscular nAChRs. (A) Experimental protocol used to assess effects of telithromycin. Currents evoked by ACh (at 10 μM for 10 s) were measured at regular intervals (2 min). Following a stabilization period, cells were exposed to a sustained concentration of telithromycin (2 μM) as indicated by the bar. The response of the cells to the same ACh test pulse was determined over 20 min. Recovery from telithromycin effects was then assessed over 10 min. (B) Effects of telithromycin on the time course of the ACh-evoked current. A typical response recorded as a control is shown in gray, and the response of the same cell after a 20-min exposure to 2 μM telithromycin is indicated in black. (C) Histogram of the peak currents measured in a series of cells (n = 3). Currents were normalized to unity versus the average responses obtained for controls using the experimental protocol depicted in panel A. Bars indicate the standard errors of means (SEM).
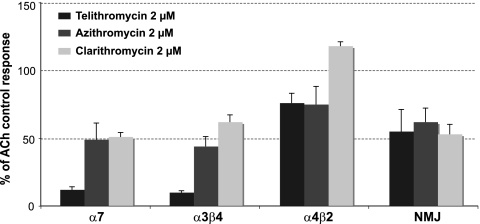
Differential inhibition of nAChRs caused by three macrolides. Measurements were carried out using the protocol depicted in Fig. 2A. The bar graph represents a plot of the normalized ACh-evoked current measured after 20 min of incubation in the presence of the macrolide versus the control. Bars indicate the SEM obtained for at least 5 cells. These data illustrate the preferential inhibition caused by telithromycin at the α3β4 and α7 receptors.
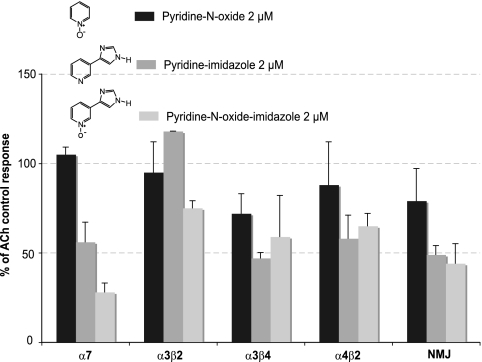
Effects of three putative metabolites of telithromycin. The levels of inhibition caused by a 20-min exposure to the putative telithromycin metabolites at a 2 μM concentration were determined using the experimental protocol illustrated in Fig. 2A. The plot of the maximum inhibition observed for each of the metabolites for four nAChR subtypes clearly illustrates the differential effects observed at the receptors. Note that the greatest inhibition was observed at α7 with pyridine-N-oxide-imidazole.
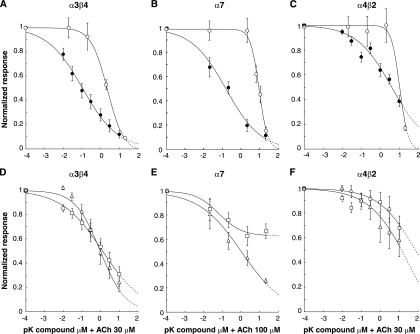
Inhibition of ganglionic and central nAChRs by four macrolides. (A to C) Concentration-inhibition curves for α3β4, α7, and α4β2 with telithromycin (closed circles) and the novel ketolide CEM-101 (open circles). (D to F) Concentration-inhibition curves for α3β4, α7, and α4β2 with azithromycin (open triangles) and clarithromycin (open squares). Responses obtained from three to seven cells were normalized versus the ACh-evoked current measured as a control and plotted as a function of the logarithm of the macrolide concentration. Bars indicate the standard errors of means. Continuous curves through the data points are the best fits obtained with the empirical Hill equation.
References
-
- Dani, J. A., and D. Bertrand. 2007. Nicotinic acetylcholine receptors and nicotinic cholinergic mechanisms of the central nervous system. Annu. Rev. Pharmacol. Toxicol. 47:699-729. - PubMed
-
- Hogg, R. C., F. Bandelier, A. Benoit, R. Dosch, and D. Bertrand. 2008. An automated system for intracellular and intranuclear injection. J. Neurosci. Methods 169:65-75. - PubMed
-
- Jarvis, L. M. 2008. The Ketek effect. Chem. Eng. News 86:861-862.
Publication types
MeSH terms
Substances
LinkOut - more resources
Full Text Sources
Other Literature Sources
Medical
