. 2010 Nov 26;285(48):37198-209.
doi: 10.1074/jbc.M110.102434. Epub 2010 Sep 20.

Whole body deletion of AMP-activated protein kinase {beta}2 reduces muscle AMPK activity and exercise capacity

Affiliations

Whole body deletion of AMP-activated protein kinase {beta}2 reduces muscle AMPK activity and exercise capacity

Gregory R Steinberg et al. J Biol Chem. .

Abstract

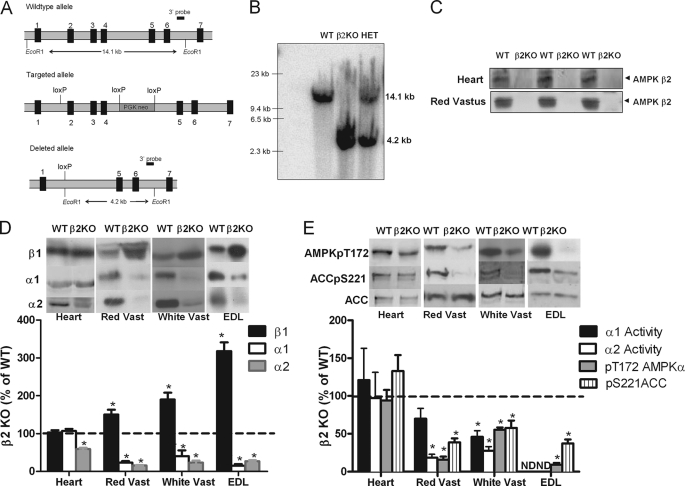
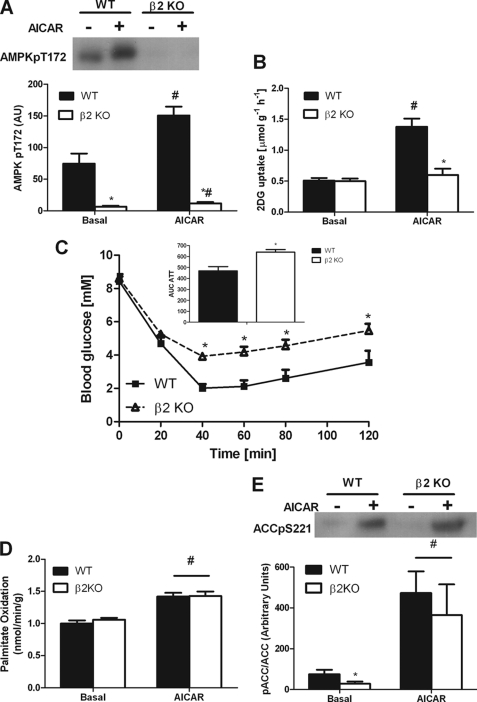
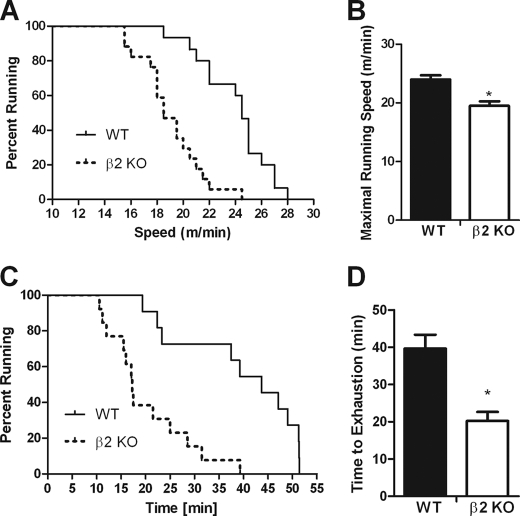
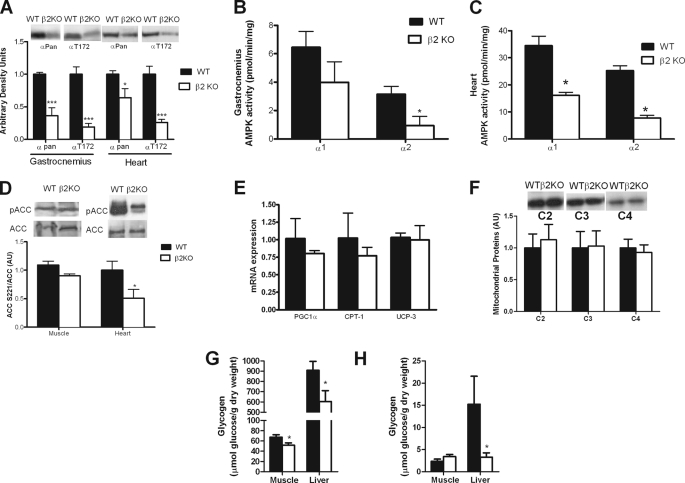
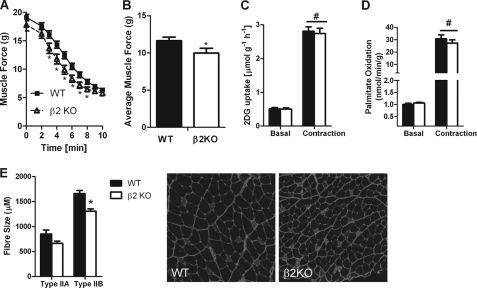
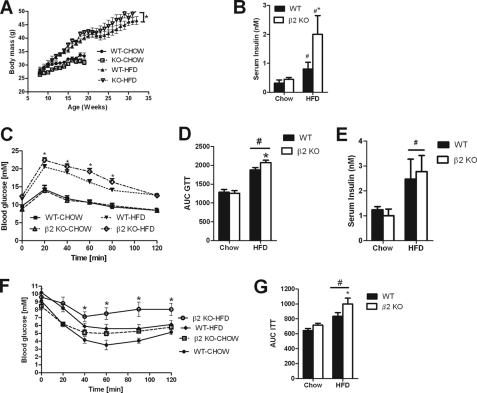
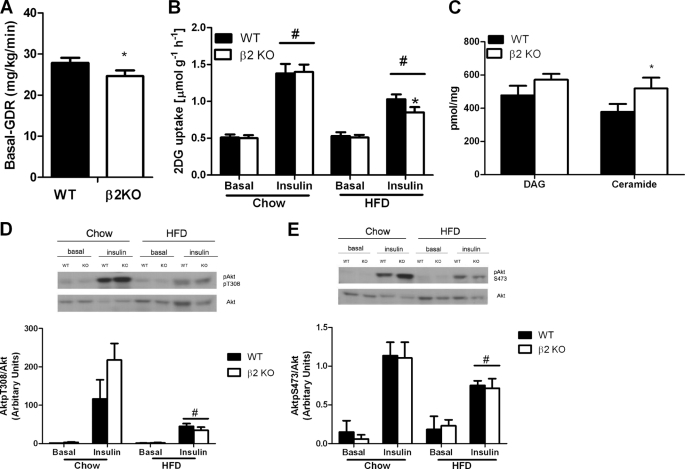
AMP-activated protein kinase (AMPK) β subunits (β1 and β2) provide scaffolds for binding α and γ subunits and contain a carbohydrate-binding module important for regulating enzyme activity. We generated C57Bl/6 mice with germline deletion of AMPK β2 (β2 KO) and examined AMPK expression and activity, exercise capacity, metabolic control during muscle contractions, aminoimidazole carboxamide ribonucleotide (AICAR) sensitivity, and susceptibility to obesity-induced insulin resistance. We find that β2 KO mice are viable and breed normally. β2 KO mice had a reduction in skeletal muscle AMPK α1 and α2 expression despite up-regulation of the β1 isoform. Heart AMPK α2 expression was also reduced but this did not affect resting AMPK α1 or α2 activities. AMPK α1 and α2 activities were not changed in liver, fat, or hypothalamus. AICAR-stimulated glucose uptake but not fatty acid oxidation was impaired in β2 KO mice. During treadmill running β2 KO mice had reduced maximal and endurance exercise capacity, which was associated with lower muscle and heart AMPK activity and reduced levels of muscle and liver glycogen. Reductions in exercise capacity of β2 KO mice were not due to lower muscle mitochondrial content or defects in contraction-stimulated glucose uptake or fatty acid oxidation. When challenged with a high-fat diet β2 KO mice gained more weight and were more susceptible to the development of hyperinsulinemia and glucose intolerance. In summary these data show that deletion of AMPK β2 reduces AMPK activity in skeletal muscle resulting in impaired exercise capacity and the worsening of diet-induced obesity and glucose intolerance.


Figures

FIGURE 1.
FIGURE 1.
Muscle-specific reductions in AMPK activity and subunit expression in AMPK β2 KO mice. A, gene targeting strategy for generation of β2 KO mice. B, genotyping of β2 KO mice by Southern blot. WT mice showed the expected 14.1-kb fragment (lane 1) and β2 KO mice the expected 4.2-kb fragment (lane 2). Heterozygous (HET) mice had one copy of each allele (lane 3). C, β2 protein expression in heart and red vastus (RV) of WT and β2 KO mice. D, percent of WT protein expression of AMPK β1, α1, α2 in heart, red, and white vastus and EDL muscles of β2 KO mice (representative blot above, densitometry below). E, percent of WT AMPK α1 and α2 activities and AMPK Thr172 and ACC Ser221 phosphorylation in heart, RV and WV muscles of β2 KO mice. Values are mean ± S.E., n = 4–7, ND, not determined. *, p < 0.05 compared with wild type.
FIGURE 2.
FIGURE 2.
Skeletal muscle of AMPK β2 KO mice have reduced glucose uptake but normal palmitate oxidation in response to AICAR. A, reduced AMPK Thr172 phosphorylation in EDL muscle of β2 KO mice both basally and following 50 min incubation with AICAR. B, β2 KO mice are insensitive to the stimulatory effects of AICAR on 2-deoxyglucose uptake in EDL muscles. C, AICAR reduces blood glucose in both WT and β2 KO mice but this reduction in glucose uptake is blunted in β2 KO mice at time points after 40 min. Inset, blood glucose area under the curve following AICAR injection. D, palmitate oxidation in isolated EDL muscle treated with or without 2 mm AICAR. E, ACC phosphorylation in isolated EDL muscle treated with or without 2 mm AICAR. Values are mean ± S.E., n = 6–15. *, p < 0.05 compared with wild type. #, p < 0.05 compared with basal.
FIGURE 3.
FIGURE 3.
AMPK β2 KO mice have reduced maximal exercise capacity and endurance. A, survival plot indicating the percent of wild type and β2 KO mice running at the indicated speed during a short duration incremental VO2 max style test. B, mean maximal running speed of wild type and β2 KO mice during the short duration incremental VO2 max style test. C, survival plot indicating percent of wild type and β2 KO mice running at the indicated time during a low intensity treadmill running test (15 m/min, 0% gradient). D, mean running time of wild type and β2 KO mice during the low intensity treadmill running test (15 m/min, 0% gradient). Survival plots data are individual data points. Other figures are mean ± S.E., n = 10–15, *, p < 0.05 compared with wild type.
FIGURE 4.
FIGURE 4.
AMPK β2 KO mice have lower heart and skeletal muscle AMPK activity after exercise, normal expression profile of mitochondrial markers but reduced levels of liver and muscle glycogen. Skeletal muscle and heart (A) AMPK α expression and Thr172 phosphorylation, AMPK α1 and α2 activities (B and C) and ACC phosphorylation (D) after 30 min of treadmill running at the same relative intensity (70% of maximal treadmill running speed). AMPK β2 KO mice have normal (E) mRNA and (F) protein levels of mitochondrial markers. Muscle and liver glycogen before (G) and after (H) 30 min of treadmill running at the same relative intensity. PGC1α, PPARγ co-activator 1α; CPT1, carnitine palmitoyltransferase-1; UCP3, uncoupling protein 3; C2, mitochondrial complex II; C3, mitochondrial complex III; C4, mitochondrial complex IV cytochrome oxidase-2. Data are mean ± S.E., n = 8. *, p < 0.05 compared with wild type; ***, p < 0.001 compared with wild type.
FIGURE 5.
FIGURE 5.
AMPK β2 KO mice have reduced muscle function ex vivo, an effect that is not associated with reductions in glucose uptake or fatty acid oxidation but decreased muscle fiber size. A, reduced muscle force over time in isolated EDL muscles from WT and β2 KO mice contracted ex vivo. B, average muscle force in WT and β2 KO mice over a 10-min contraction period. Contraction-stimulated (C) glucose uptake and (D) fatty acid oxidation were not different between WT and β2 KO mice. E, EDL muscles from β2 KO mice have smaller Type IIA and IIB muscle fibers compared with WT littermates. Values are mean ± S.E., n = 6–15. *, p < 0.05 compared with wild type. #, p < 0.05 compared with basal.
FIGURE 6.
FIGURE 6.
High-fat diet fed AMPK β2 KO mice gain more weight over time and are more susceptible to glucose intolerance and hyperinsulinemia. A, body mass over time in WT and β2 KO mice. B, hyperinsulinemia in AMPK β2 KO mice fed a HFD. C and D, impaired glucose tolerance in β2KO mice fed a HFD. E, serum insulin levels in chow and HFD-fed mice 20 min after injection with glucose (1 mg/kg). F and G, whole body insulin sensitivity following a bolus of insulin (0.75 units/kg). Values are mean ± S.E., n = 7–13. *, p < 0.05 compared with wild type. #, p < 0.05 compared with chow diet.
FIGURE 7.
FIGURE 7.
High-fat diet fed AMPK β2 KO mice have reduced glucose uptake and increased levels of muscle ceramide. A, basal glucose disposal rate (GDR) during hyperinsulinemic-euglycemic clamp in HFD-fed WT and β2 KO mice (n = 5–6). B, 2-deoxyglucose uptake in isolated EDL muscles from chow and HFD-fed WT and β2 KO mice treated with or without insulin. C, diacylglycerol (DAG) and ceramide levels in tibialis anterior muscle from HFD-fed WT and β2 KO mice (n = 6). Akt (D) Thr308 and (E) Ser473 phosphorylation in isolated EDL muscles from chow and HFD-fed WT and β2 KO mice treated with or without insulin. Values are mean ± S.E., n = 7–13. *, p < 0.05 compared with wild type. #, p < 0.05 compared with chow diet.

Similar articles

Cited by

References

    1. Steinberg G. R., Kemp B. E. (2009) Physiol. Rev. 89, 1025–1078 - PubMed
    1. Richter E. A., Ruderman N. B. (2009) Biochem. J. 418, 261–275 - PMC - PubMed
    1. Kahn B. B., Alquier T., Carling D., Hardie D. G. (2005) Cell Metabolism 1, 15–25 - PubMed
    1. Long Y. C., Zierath J. R. (2006) J. Clin. Invest. 116, 1776–1783 - PMC - PubMed
    1. Dzamko N. L., Steinberg G. R. (2009) Acta Physiol. (OXF) 196, 115–127 - PubMed

Publication types