. 2010 Sep 1;9(17):3515-33.
doi: 10.4161/cc.9.17.12928. Epub 2010 Sep 9.

Autophagy in cancer associated fibroblasts promotes tumor cell survival: Role of hypoxia, HIF1 induction and NFκB activation in the tumor stromal microenvironment

Affiliations

Autophagy in cancer associated fibroblasts promotes tumor cell survival: Role of hypoxia, HIF1 induction and NFκB activation in the tumor stromal microenvironment

Ubaldo E Martinez-Outschoorn et al. Cell Cycle. .

Abstract

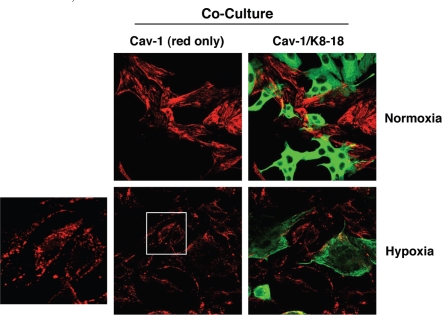
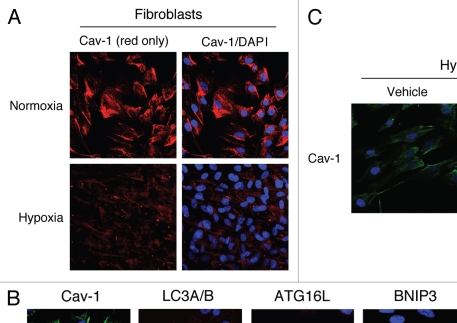
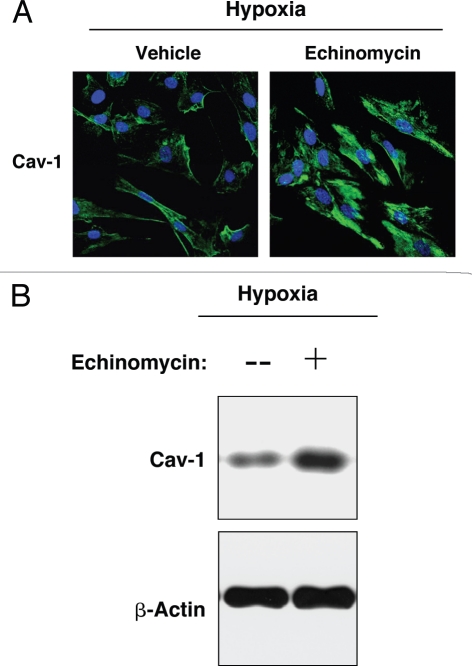
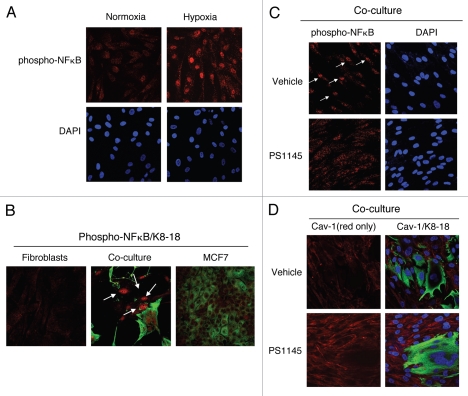
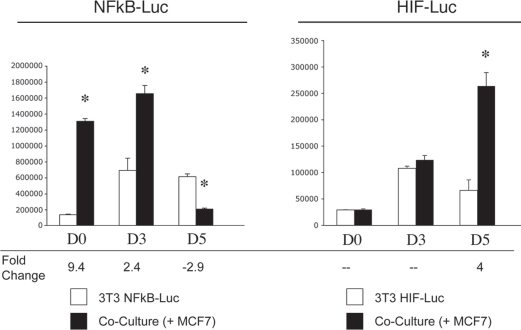
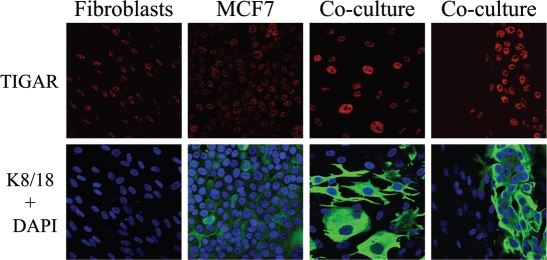
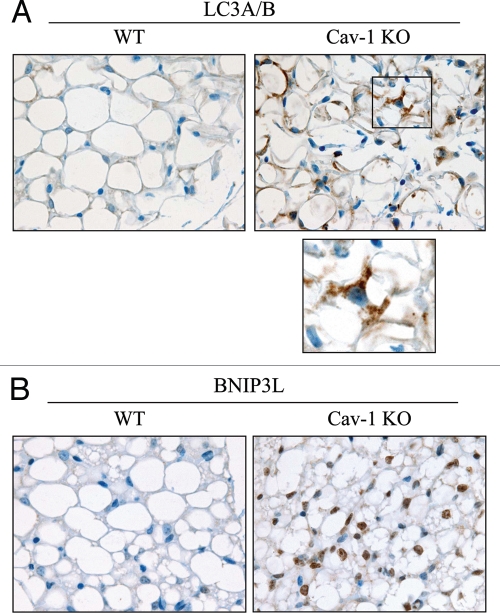
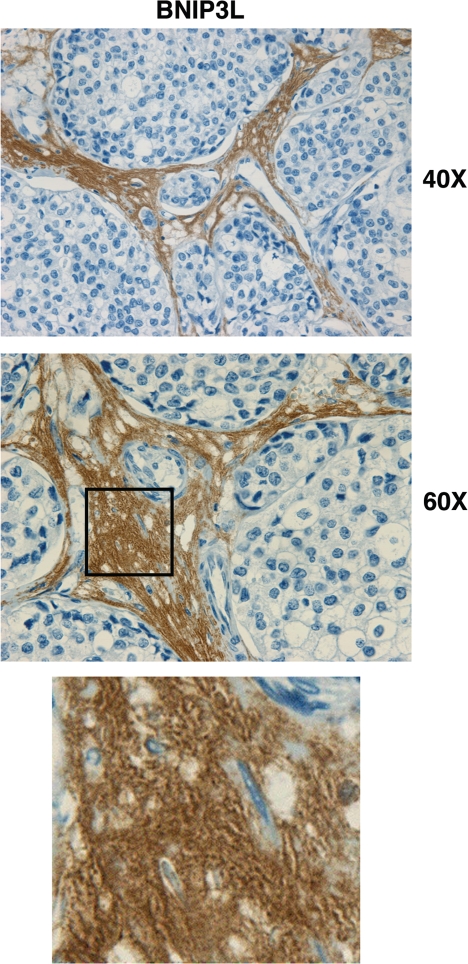
Recently, using a co-culture system, we demonstrated that MCF7 epithelial cancer cells induce oxidative stress in adjacent cancer-associated fibroblasts, resulting in the autophagic/lysosomal degradation of stromal caveolin-1 (Cav-1). However, the detailed signaling mechanism(s) underlying this process remain largely unknown. Here, we show that hypoxia is sufficient to induce the autophagic degradation of Cav-1 in stromal fibroblasts, which is blocked by the lysosomal inhibitor chloroquine. Concomitant with the hypoxia-induced degradation of Cav-1, we see the upregulation of a number of well-established autophagy/mitophagy markers, namely LC3, ATG16L, BNIP3, BNIP3L, HIF-1α and NFκB. In addition, pharmacological activation of HIF-1α drives Cav-1 degradation, while pharmacological inactivation of HIF-1 prevents the downregulation of Cav-1. Similarly, pharmacological inactivation of NFκB--another inducer of autophagy-prevents Cav-1 degradation. Moreover, treatment with an inhibitor of glutathione synthase, namely BSO, which induces oxidative stress via depletion of the reduced glutathione pool, is sufficient to induce the autophagic degradation of Cav-1. Thus, it appears that oxidative stress mediated induction of HIF1- and NFκB-activation in fibroblasts drives the autophagic degradation of Cav-1. In direct support of this hypothesis, we show that MCF7 cancer cells activate HIF-1α- and NFκB-driven luciferase reporters in adjacent cancer-associated fibroblasts, via a paracrine mechanism. Consistent with these findings, acute knock-down of Cav-1 in stromal fibroblasts, using an siRNA approach, is indeed sufficient to induce autophagy, with the upregulation of both lysosomal and mitophagy markers. How does the loss of stromal Cav-1 and the induction of stromal autophagy affect cancer cell survival? Interestingly, we show that a loss of Cav-1 in stromal fibroblasts protects adjacent cancer cells against apoptotic cell death. Thus, autophagic cancer-associated fibroblasts, in addition to providing recycled nutrients for cancer cell metabolism, also play a protective role in preventing the death of adjacent epithelial cancer cells. We demonstrate that cancer-associated fibroblasts upregulate the expression of TIGAR in adjacent epithelial cancer cells, thereby conferring resistance to apoptosis and autophagy. Finally, the mammary fat pads derived from Cav-1 (-/-) null mice show a hypoxia-like response in vivo, with the upregulation of autophagy markers, such as LC3 and BNIP3L. Taken together, our results provide direct support for the "Autophagic Tumor Stroma Model of Cancer Metabolism", and explain the exceptional prognostic value of a loss of stromal Cav-1 in cancer patients. Thus, a loss of stromal fibroblast Cav-1 is a biomarker for chronic hypoxia, oxidative stress and autophagy in the tumor microenvironment, consistent with its ability to predict early tumor recurrence, lymph node metastasis and tamoxifen-resistance in human breast cancers. Our results imply that cancer patients lacking stromal Cav-1 should benefit from HIF-inhibitors, NFκB-inhibitors, anti-oxidant therapies, as well as autophagy/lysosomal inhibitors. These complementary targeted therapies could be administered either individually or in combination, to prevent the onset of autophagy in the tumor stromal compartment, which results in a "lethal" tumor microenvironment.


Figures

Figure 1
Figure 1
Electron microscopy shows that fibroblasts in co-culture display increased autophagy and MCF7 cells exhibit abundant mitochondria. To monitor the status of autophagy, hTERT-fibroblasts and MCF7 cells were co-cultured for three days, fixed and evaluated by electron microscopy. (A and B) Co-cultured fibroblasts display numerous lysosomes and autophagosomes. (A) The EM image represents a fibroblast with numerous lysosomes (arrows) and autophagosomes (boxed area). (B) The higher magnification of the boxed area depicts an autophagosome. Note that the autophagosome shows (i) a double-membrane (arrowhead) and (ii) organelles within that appear to be degraded mitochondria (arrows). Bars = 1 µm for (A); = 0.2 µm for (B). (C) Co-cultured MCF7 cells exhibit the presence of many mitochondria. Note that co-cultured MCF7 cells exhibit the presence of many mitochondria (arrows) and of intermediate keratin filaments (demonstrating their epithelial origin). N, nucleus.
Figure 2
Figure 2
Hypoxia induces Cav-1 downregulation in co-cultured fibroblasts. hTERT-fibroblast-MCF7 co-cultures were placed in hypoxia (0.5% O2) or normoxia (21% O2) for 3 days. Then, cells were fixed and immuno-stained with anti-Cav-1 (Red) and anti-K8-18 (Green) antibodies. Cav-1 staining (red only) is shown on the left to better appreciate hypoxia-induced Cav-1 downregulation. Note that during hypoxia, Cav-1 is localized to intracellular vesicles. The boxed area is shown enlarged on the left to illustrate that Cav-1 accumulates in intracellular vesicles, consistent with an autophagic/lysosomal degradation mechanism. Original magnification, 40x.
Figure 3
Figure 3
Hypoxia-induced autophagy drives Cav-1 degradation in fibroblasts: Rescue with chloroquine, an autophagy inhibitor. (A) Hypoxia decreases Cav-1 levels in homotypic fibroblasts. Homotypic cultures of hTERT-fibroblasts were placed in hypoxia (0.5% O2) or normoxia (21% O2) for three days. Then, cells were fixed and stained with anti-Cav-1 (red) antibodies and DAPI nuclear stain (blue). Cav-1 staining (red only) is shown at left to better appreciate the hypoxia-induced Cav-1 degradation. Original magnification, 40x. (B) Hypoxia-induced Cav-1 downregulation correlates with the expression of autophagic markers. hTERT-fibroblasts were subjected to hypoxia (0.5% O2, lower panels) or normoxia (21% O2, upper panels) for 48 hours. Then, the cells were fixed and stained with antibodies against either Cav-1 (green) or the indicated autophagic markers (red). DAPI was used to stain nuclei (blue). Note that hypoxia induces Cav-1 downregulation, while promoting autophagy. Original magnification, 80x. (C) The autophagy inhibitor chloroquine rescues the hypoxia-induced downregulation of Cav-1. To block hypoxia-induced Cav-1 degradation, hTERT-fibroblasts were subjected to hypoxia in the presence of the autophagic inhibitor chloroquine (25 µM) or vehicle alone control (H2O) for 24 hours. Then, cells were fixed and stained with anti-Cav-1 (green) antibodies and DAPI nuclear stain (blue). Note that chloroquine treatment prevents the hypoxia-induced degradation of Cav-1, as compared with control cells. Original magnification, 60x.
Figure 4
Figure 4
Oxidative stress-induced autophagy correlates with Cav-1 downregulation. BSO treatment downregulates Cav-1 while promoting autophagy. To induce oxidative stress, hTERT-fibroblasts were treated with increasing concentration of BSO (1 µM and 1 mM) for 48 hours. Cell lysates were then analyzed by Western blot analysis using anti-Cav-1 and LC3B antibodies. Note that Cav-1 levels are greatly decreased upon treatment with 1 mM of the pro-oxidant BSO. At the same concentration of BSO, the accumulation of the active LC3B-II form is highest. β-actin was used as a control to assess equal protein loading.
Figure 5
Figure 5
Activation of HIF-1α correlates with Cav-1 downregulation in fibroblasts. (A) Hypoxia-induced HIF-1α activation correlates with decreased Cav-1 levels in fibroblasts. Homotypic cultures of hTERT-fibroblasts were placed in hypoxia (0.5% O2) or normoxia (21% O2) for 3 days. Cells were lysed and analyzed by western blot analysis using anti-Cav-1 and HIF-1α antibodies. Note that HIF-1α accumulation correlates with decreased Cav-1 levels during hypoxia. β-tubulin was used as a control to assess equal protein loading. (B) Re-oxygenation restores Cav-1 levels. Co-cultures of hTERT-fibroblasts and MCF7 cells were placed either in normoxia or in hypoxia or in hypoxia followed by normoxia (hypoxia + normoxia). Then, the cells were fixed and immuno-stained with anti-Cav-1 (red) and anti-HIF-1α (green) antibodies. The left panels show the red channel only to better appreciate Cav-1 staining. Upon hypoxia, fibroblasts display HIF-1α nuclear accumulation and decreased Cav-1 expression. The boxed area is shown enlarged on the left to better illustrate the distribution of Cav-1 within intracellular vesicles, consistent with the idea that Cav-1 is degraded by an autophagic/lysosomal mechanism. Interestingly, re-oxygenation (hypoxia + normoxia, middle panels) restores Cav-1 expression, while inducing HIF-1α degradation in fibroblasts. However, HIF-1α is further activated and maintained in MCF7 cells after re-oxygenation (hypoxia + normoxia, middle panels). Original magnification, 40x.
Figure 6
Figure 6
Pharmacological activation of HIF-1α downregulates Cav-1 levels. (A) Immunofluorescence. to pharmacologically activate HIF-1α, co-cultures of hTERT-fibroblasts and MCF7 cells were treated with PHD inhibitors, such as DMOG, 2,4 DPD and 1,4 DPCA. Cells were then fixed and immuno-stained with anti-Cav-1 (red) and anti-K8-18 (green) antibodies. Nuclei were stained with DAPI (blue). Cav-1 staining (red channel only) is shown on the left to better appreciate the decreased Cav-1 levels, after treatment with the PHD inhibitors. Importantly, images were acquired using identical exposure settings. Original magnification, 40x. (B) Western blot. Homotypic cultures of hTERT-fibroblasts were treated with the PHD inhibitor DMOG (500 µM) or vehicle control (DMSO) for 24 hours. Cell lysates were analyzed by western blot analysis using anti-Cav-1 antibodies. Note that Cav-1 levels are greatly decreased upon treatment with the HIF-1α inducer DMOG. β-actin was used as a control for equal protein loading.
Figure 7
Figure 7
Pharmacological inhibition of HIF-1α rescues the hypoxia-induced downregulation of Cav-1. (A) Immunofluorescence. hTERT-fibroblasts were subjected to hypoxia (0.5% O2) for 24 hours in the presence of the HIF-1α inhibitor echinomycin (10 ng/ml) or vehicle alone (DMSO). Then, the cells were fixed and stained with anti-Cav-1 (green) antibodies and DAPI nuclear stain (blue). Note that treatment with the HIF-1α inhibitor rescues the hypoxia-induced downregulation of Cav-1, as compared to vehicle alone treated cells. Original magnification, 60x. (B) Western blot. hTERT-fibroblasts were subjected to hypoxia (0.5% O2) for 48 hours in the presence of echinomycin (2 ng/ml) or vehicle alone (DMSO). Cell lysates were analyzed by western blot analysis using anti-Cav-1 antibodies. Note that Cav-1 levels are greatly increased upon treatment with the HIF-1α inhibitor. β-actin was used as an equal loading control.
Figure 8
Figure 8
Activation of the pro-autophagic NFκB pathway induces Cav-1 downregulation. (A) NFκB is activated during hypoxia. hTERT-fibroblasts were subjected to hypoxia (0.5% O2) or normoxia for 48 hours. Then, the cells were fixed and stained with phospho-NFκB (phospho-p65 at Ser 276, red) antibodies and DAPI nuclear stain (blue). Note that hypoxia promotes the activation of the pro-autophagic NFκB pathway. Original magnification, 40x. (B) NFκB signaling is activated in co-cultured fibroblasts. Day 5 hTERT-fibroblast-MCF7 cell co-cultures were fixed and immuno-stained with antibodies against phospho-NFκB (phospho-p65 at Ser 276, red) and anti-K8-18 (green). As control, homotypic cultures of fibroblasts and MCF7 cells were fixed and stained in parallel. Note that phospho-NFκB is exclusively detected in co-cultured fibroblasts nuclei (white arrows). Importantly, images were acquired using identical exposure settings. Original magnification, 40x. (C and D) Treatment with the NFκB inhibitor PS115 restores Cav-1 expression in co-culture. Day 5 hTERT-fibroblast-MCF7 co-cultures were treated with 10 µM PS1145 or vehicle alone (DMSO) for 24 hours. (C) Cells were fixed and immuno-stained with anti-phospho-NFκB antibodies (red). Nuclei were stained with DAPI (blue). As expected, the accumulation of phospho-NFκB in co-cultured cells (white arrows) is abolished by treatment with the NFκB inhibitor. Original magnification, 40x. (D) Cells were fixed and immunostained with anti-Cav-1 (red) and anti-K8-18 (green) antibodies. Nuclei were stained with DAPI (blue). Note that treatment with the NFκB inhibitor PS1145 restores Cav-1 expression in co-cultured fibroblasts. The red only image is shown on the left to better appreciate Cav-1 staining. Original magnification, 40x.
Figure 9
Figure 9
Cav-1 knockdown is sufficient to promote autophagy/mitophagy. (A) Acute Cav-1 downregulation activates the autophagy inducer NFκB. hTERT-fibroblasts treated with Cav-1 siRNA (right) or control siRNA (left) were fixed and immuno-stained with antibodies against phospho-NFκB (phospho-p65 at Ser 276, green). DAPI was used to visualize nuclei (blue). Note that Cav-1 knockdown is sufficient to induce phospho-NFκB nuclear localization and activation. White arrows point at the nuclear localization of phospho-NFκB in Cav-1 siRNA treated cells. Importantly, images were acquired using identical exposure settings. Original magnification, 40x. (B and C) Acute loss of Cav-1 increases the expression of autophagic markers. hTERT-fibroblasts were treated with Cav-1 siRNA or control (CTR) siRNA. (B) Western blot analysis. Cells were analyzed by western blot analysis using antibodies against the indicated autophagic markers. β-tubulin was used as equal loading control. (C) Immunofluorescence. Cells were fixed and immuno-stained with antibodies against beclin 1, BNIP3 and BNIP3L. DAPI was used to visualize nuclei (blue). Importantly, paired images were acquired using identical exposure settings. Original magnification, 40x. Note that acute Cav-1 knockdown is sufficient to greatly increase the expression levels of all the autophagy/mitophagy markers we examined.
Figure 10
Figure 10
Cancer cells promote the activation of the pro-autophagic NFκB and HIF-1α pathways in adjacent fibroblasts. NIH3T3-HIF-Luc or NIH3T3-NFκB-Luc reporter fibroblasts were plated with MCF7 cells. The next day, the media was changed and that was considered day 0. Cells were then cultured for up to 5 days. As a control, homotypic cultures of fibroblasts were established and processed in parallel. Luciferase activity was measured at day 0, 3 and 5. The graph on the left shows data generated using NIH3t3-NFκB-Luc cells, whereas the graph on the right graph represents data from the use of NIH3T3-HIF-Luc cells. Note that luciferase activity is increased by 9-fold and 2-fold respectively at day 0 and 3 in NFκB-Luc co-cultured fibroblasts, compared to homotypic cultures. These results suggest that the NFκB pathway is potently activated as an early event during co-culture. Conversely, luciferase activity is increased by ∼4-fold at day 5 in NIH3T3-HIF-Luc co-cultured cells, compared to homotypic cultures, suggesting that HIF-1α activation occurs at a later time-point. *p = 0.000004 for day 0 NFκB-Luc, *p = 0.006 for day 3 NFκB-Luc, *p = 0.0003 for day 5 NFκB-Luc, *p = 0.003 for day 5 HIF-Luc (Student's t-test).
Figure 11
Figure 11
Loss of Cav-1 in fibroblasts protects adjacent MCF7 cells against apoptosis. MCF7 cells were co-cultured for 72 hours with hTERT-fibroblasts carrying either a GFP (+) control shRNA (CTR) vector or a GFP (+) Cav-1 shRNA (KD) vector. Corresponding homotypic cultures were established in parallel. Then, the cells were subjected to annexin-V staining and analyzed by FACS. Thus, the GFP (+) and GFP (−) cells represent hTERT-fibroblasts and MCF7 cells, respectively. (A) MCF7 cell apoptotic rate: Cav-1 knockdown fibroblasts protect MCF7 cells against apoptosis. MCF7 cells co-cultured with CTR-fibroblasts show an ∼3-fold reduction in apoptosis, as compared to MCF7 cells cultured alone. However, co-cultures with KD fibroblasts provide MCF7 cells with a greater protection against apoptosis (8.5-fold decrease in apoptotic rate compared to MCF7 cell mono-cultures). The upper graph represents the percentage of annexin-V (+) cells. The lower graph represents the fold change versus MCF7 cells cultured in the absence of fibroblasts. *p ≤ 0.0002, **p ≤ 0.0000006 versus MCF7 cells cultured alone. *p ≤ 0.02 versus Cav-1 KD (Student's t-test). (B) Fibroblast apoptotic rate: Cav-1 knockdown protects fibroblasts against apoptosis. In homotypic cultures, KD fibroblasts are protected by 2.7-fold against apoptosis as compared to CTR fibroblasts. In addition, CTR fibroblasts co-cultured with MCF7 cells display a 2.4-fold increase in apoptosis, compared to CTR mono-cultures. Interestingly, co-cultured KD fibroblasts exhibit a 2-fold decrease in apoptosis compared to co-cultured CTR fibroblasts. These results suggest that a loss of Cav-1 protects fibroblasts in co-culture against apoptosis. *p = 0.03 versus the other three experimental conditions (Student's t-test).
Figure 12
Figure 12
Co-cultured MCF7 cells display the upregulation of the autophagy and apoptosis inhibitor TIGAR. Day 5 hTERT-fibroblast-MCF7 co-cultures were fixed and immuno-stained with antibodies against TIGAR (red) and anti-K8-18 (green). DAPI was used to visualize nuclei (blue). As a control, homotypic cultures of fibroblasts and MCF7 cells were fixed and stained in parallel. Note that TIGAR is greatly upregulated in co-cultured MCF7 cells as compared to MCF7 cells mono-cultures. Importantly, images were acquired using identical exposure settings. Original magnification, 40x.
Figure 13
Figure 13
Cav-1 gene deletion in mice induces a pseudo-hypoxic phenotype. To monitor hypoxia signaling in vivo, the hypoxia marker pimonidazole was injected in the tail vein of WT and Cav-1 (−/−) null mice. One hour post-injection, mice were sacrificed and the mammary glands and lungs were collected. Paraffin-embedded sections of mammary gland and lung were immuno-stained using a rabbit antiserum to pimonidazole. Slides were counter-stained with hematoxylin. Note that both the mammary fat pads and the lung parenchyma of Cav-1 (−/−) null mice display strong anti-pimonidazole staining. These data suggest that Cav-1 (−/−) mice undergo pseudo-hypoxic stress at steady-state. Original magnification, 40x.
Figure 14
Figure 14
Cav-1 (−/−) null mammary glands exhibit increased autophagy. To monitor autophagy in vivo, paraffin-embedded sections of mammary glands from 5 month old WT and Cav-1 (−/−) null mice were immuno-stained with two markers of autophagy, LC3A/B (A) and BNIP3L (B). Slides were counter-stained with hematoxylin. Note that both LC3A/B and BNIP3L are greatly increased in Cav-1 (−/−) mammary fat pads. The boxed area of LC3A/B staining is shown at higher magnification to better appreciate the LC3 positive vesicles in Cav-1 (−/−) adipocytes. Original magnification, 60x.
Figure 15
Figure 15
BNIP3L is highly increased in the stroma of human breast cancers that lack stromal Cav-1. Paraffin-embedded sections of human breast cancer samples lacking stromal Cav-1 were immuno-stained with antibodies directed against BNIP3L (ab59908; Abcam). Slides were then counter-stained with hematoxylin. Note that BNIP3L is highly expressed in the stromal compartment of human breast cancers that lack stromal Cav-1. The boxed area shown at higher magnification reveals punctate staining, consistent with mitochondrial and/or lysosomal localization. Original magnification, 40x and 60x, as indicated.
Figure 16
Figure 16
Autophagy in cancer associated fibroblasts (CAFs) fuels tumor cell survival. Here, we present a new model in which cancer cells trigger oxidative stress and activate two pro-autophagic drivers, namely HIF-1α and NFκB, in adjacent fibroblasts. Thus, CAFs undergo autophagy and mitophagy, leading to a loss of Cav-1 and metabolic re-programming. A loss of stromal Cav-1 aggravates oxidative stress and further promotes autophagy and mitophagy. Stromal autophagy generates building blocks (such as recycled free amino acids, fatty acids and nucleotides) that can be directly utilized by cancer cells to sustain growth and maintain cell viability. HIF-1α activation and consequent mitophagy in CAFs induces mitochondrial dys-function and enhances aerobic glycolysis, leading to the secretion of high-energy nutrients (such as lactate and pyruvate) that can directly feed mitochondrial biogenesis and oxidative mitochondrial metabolism in cancer cells. Loss of Cav-1 in stromal cells protects cancer cells from apoptosis, at least in part via TIGAR upregulation. In this model, TIGAR protects epithelial cancer cells from oxidative stress by simultaneously inhibiting three inter-related cellular processes, namely (1) aerobic glycolysis, (2) apoptosis and (3) autophagy. Thus, epithelial cancer cells exploit CAFs to satisfy their increased energy demand by forcing these stromal cells to undergo a unilateral and vectorial energy transfer (via compartment-specific autophagy) to sustain epithelial cancer cell growth. Transfer of nutrients from autophagy-prone catabolic stromal cells to autophagy-resistant anabolic cancer cells promotes epithelial cancer cell survival, thereby enhancing tumor growth.

Similar articles

Cited by

References

    1. Papandreou I, Cairns RA, Fontana L, Lim AL, Denko NC. HIF-1 mediates adaptation to hypoxia by actively downregulating mitochondrial oxygen consumption. Cell Metab. 2006;3:187–197. - PubMed
    1. Kim JW, Tchernyshyov I, Semenza GL, Dang CV. HIF-1-mediated expression of pyruvate dehydrogenase kinase: a metabolic switch required for cellular adaptation to hypoxia. Cell Metab. 2006;3:177–185. - PubMed
    1. Salceda S, Caro J. Hypoxia-inducible factor 1alpha (HIF-1alpha) protein is rapidly degraded by the ubiquitin-proteasome system under normoxic conditions. Its stabilization by hypoxia depends on redox-induced changes. J Biol Chem. 1997;272:22642–22647. - PubMed
    1. Guzy RD, Hoyos B, Robin E, Chen H, Liu L, Mansfield KD, et al. Mitochondrial complex III is required for hypoxia-induced ROS production and cellular oxygen sensing. Cell Metab. 2005;1:401–408. - PubMed
    1. Schofield CJ, Ratcliffe PJ. Signalling hypoxia by HIF hydroxylases. Biochem Biophys Res Commun. 2005;338:617–626. - PubMed

Publication types

MeSH terms