

Condensed mitotic chromosome structure at nanometer resolution using PALM and EGFP- histones
- PMID: 20856676
- PMCID: PMC2939896
- DOI: 10.1371/journal.pone.0012768
Condensed mitotic chromosome structure at nanometer resolution using PALM and EGFP- histones
Abstract
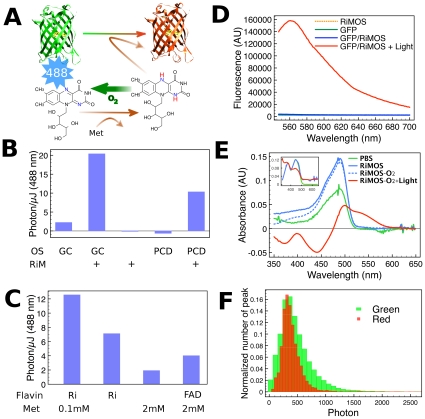
Photoactivated localization microscopy (PALM) and related fluorescent biological imaging methods are capable of providing very high spatial resolutions (up to 20 nm). Two major demands limit its widespread use on biological samples: requirements for photoactivatable/photoconvertible fluorescent molecules, which are sometimes difficult to incorporate, and high background signals from autofluorescence or fluorophores in adjacent focal planes in three-dimensional imaging which reduces PALM resolution significantly. We present here a high-resolution PALM method utilizing conventional EGFP as the photoconvertible fluorophore, improved algorithms to deal with high levels of biological background noise, and apply this to imaging higher order chromatin structure. We found that the emission wavelength of EGFP is efficiently converted from green to red when exposed to blue light in the presence of reduced riboflavin. The photon yield of red-converted EGFP using riboflavin is comparable to other bright photoconvertible fluorescent proteins that allow <20 nm resolution. We further found that image pre-processing using a combination of denoising and deconvolution of the raw PALM images substantially improved the spatial resolution of the reconstruction from noisy images. Performing PALM on Drosophila mitotic chromosomes labeled with H2AvD-EGFP, a histone H2A variant, revealed filamentous components of ∼70 nm. This is the first observation of fine chromatin filaments specific for one histone variant at a resolution approximating that of conventional electron microscope images (10-30 nm). As demonstrated by modeling and experiments on a challenging specimen, the techniques described here facilitate super-resolution fluorescent imaging with common biological samples.
Conflict of interest statement
Figures


Similar articles
-
Evidence of activity-specific, radial organization of mitotic chromosomes in Drosophila.PLoS Biol. 2011 Jan 11;9(1):e1000574. doi: 10.1371/journal.pbio.1000574. PLoS Biol. 2011. PMID: 21264350 Free PMC article.
-
Super-resolution imaging of the bacterial division machinery.J Vis Exp. 2013 Jan 21;(71):50048. doi: 10.3791/50048. J Vis Exp. 2013. PMID: 23380691 Free PMC article.
-
Photoactivated Localization Microscopy with Bimolecular Fluorescence Complementation (BiFC-PALM).J Vis Exp. 2015 Dec 22;(106):e53154. doi: 10.3791/53154. J Vis Exp. 2015. PMID: 26779930 Free PMC article.
-
Super-resolution microscopy approaches to nuclear nanostructure imaging.Methods. 2017 Jul 1;123:11-32. doi: 10.1016/j.ymeth.2017.03.019. Epub 2017 Apr 6. Methods. 2017. PMID: 28390838 Review.
-
Photoactivatable BODIPYs for Live-Cell PALM.Molecules. 2023 Mar 7;28(6):2447. doi: 10.3390/molecules28062447. Molecules. 2023. PMID: 36985424 Free PMC article. Review.
Cited by
-
Seeing chromosome structure reveals its function.Chromosome Res. 2021 Mar;29(1):1-3. doi: 10.1007/s10577-021-09657-2. Chromosome Res. 2021. PMID: 33713240 No abstract available.
-
Single-molecule quantification of lipotoxic expression of activating transcription factor 3.Phys Chem Chem Phys. 2014 Oct 21;16(39):21595-21601. doi: 10.1039/c4cp03260h. Epub 2014 Sep 5. Phys Chem Chem Phys. 2014. PMID: 25189785 Free PMC article.
-
Switchable Fluorophores for Single-Molecule Localization Microscopy.Chem Rev. 2018 Sep 26;118(18):9412-9454. doi: 10.1021/acs.chemrev.7b00767. Epub 2018 Sep 17. Chem Rev. 2018. PMID: 30221931 Free PMC article. Review.
-
Super-resolution microscopy reveals decondensed chromatin structure at transcription sites.Sci Rep. 2014 Mar 26;4:4477. doi: 10.1038/srep04477. Sci Rep. 2014. PMID: 24667378 Free PMC article.
-
Chromosome conformation maps in fission yeast reveal cell cycle dependent sub nuclear structure.Nucleic Acids Res. 2014 Nov 10;42(20):12585-99. doi: 10.1093/nar/gku965. Epub 2014 Oct 23. Nucleic Acids Res. 2014. PMID: 25342201 Free PMC article.
References
-
- Kornberg RD, Lorch Y. Twenty-Five Years of the Nucleosome, Fundamental Particle of the Eukaryote Chromosome. Cell. 1999;98:285–294. - PubMed
-
- Horowitz-Scherer RA, Woodcock CL. Organization of interphase chromatin. Chromosoma. 2006;115:1–14. - PubMed
-
- Spector DL. The dynamics of chromosome organization and gene regulation. Annu Rev Biochem. 2003;72:573–608. - PubMed
-
- Taddei A, Hediger F, Neumann F, Gasser S. The function of nuclear architecture: a genetic approach. Annu Rev Genet. 2004;38:305–45. - PubMed
Publication types
MeSH terms
Substances
Grants and funding
LinkOut - more resources
Full Text Sources
Molecular Biology Databases
Research Materials
