doi: 10.1200/JOP.0843501.
The 2007 national practice benchmark: results of a national survey of oncology practices
- PMID: 20856769
- PMCID: PMC2793960
- DOI: 10.1200/JOP.0843501
Item in Clipboard
The 2007 national practice benchmark: results of a national survey of oncology practices
J Oncol Pract.
2008 Jul.
Abstract
Long-term trends in the cost of pharmaceutical goods purchased by community oncology practices seem to have dramatically changed in 2007, potentially ending an era of practice growth built on the economic engine of in-office chemotherapy provision.
Figures
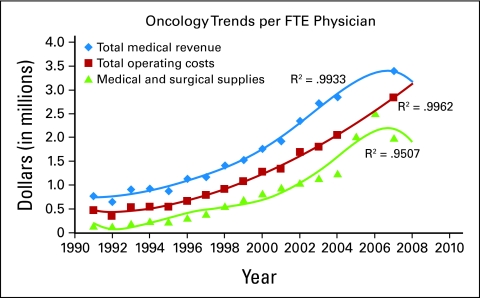
Oncology trends per full-time equivalent (FTE) physician.
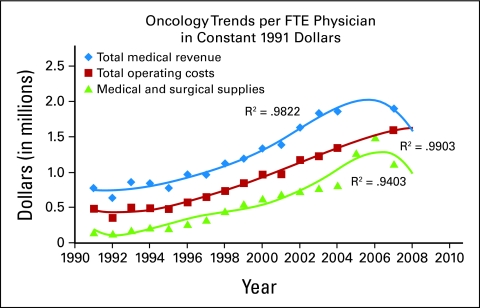
Oncology trends per full-time equivalent (FTE) physician in constant 1991 dollars.
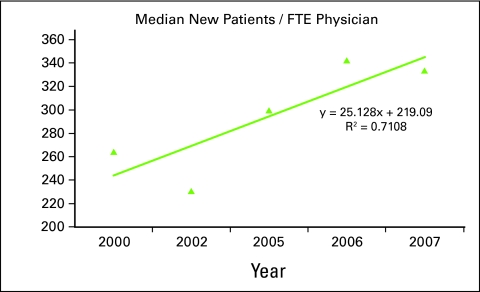
Median new patients per full-time equivalent (FTE) physician, 2000 to 2007.
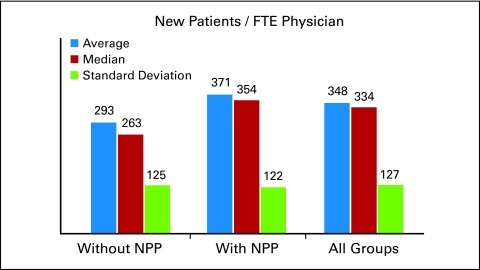
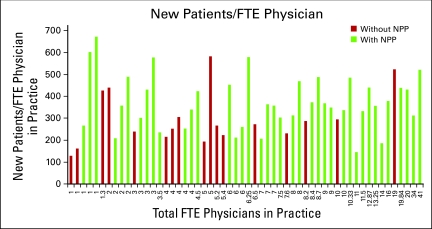
New patients per full-time equivalent (FTE) physician, with and without nonphysician practitioners (NPPs).
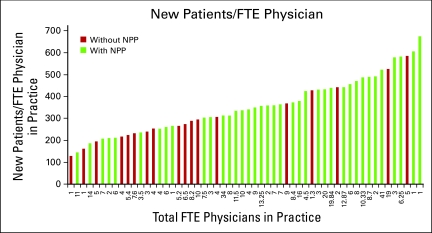
New patients per full-time equivalent (FTE) physician, with and without nonphysician practitioners (NPPs), arrayed by practice size.
New patients per full-time equivalent (FTE) physician, with and without nonphysician practitioners (NPPs), arrayed by number of new patients.
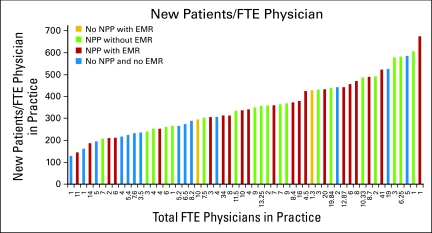
New patients per full-time equivalent (FTE) physician, with and without nonphysician practitioners (NPPs) and electronic medical record systems (EMRs).
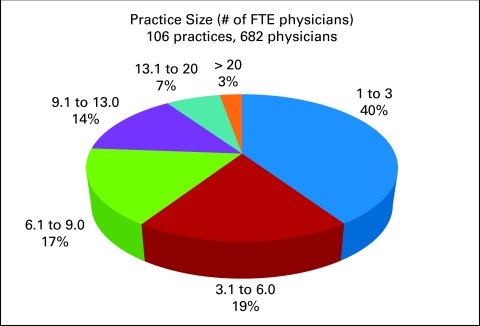
Practice size. Number of full-time equivalent (FTE) physicians.
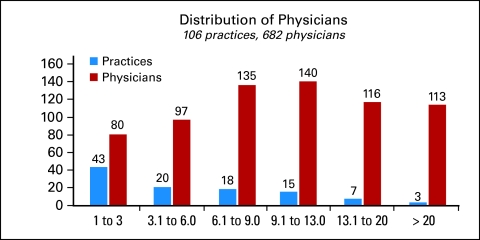
Distribution of physicians by practice size.
References
-
- Medical Group Management Association: Cost survey for Hematology/Oncology Practices: 2001 Report Based on 2000 Data. Englewood, CO, Medical Group Management Association, 2001
-
- Medical Group Management Association: Cost Survey for Hematology/Oncology Practices: 2003 Report Based on 2002 Data. Englewood, CO, Medical Group Management Association, 2003
-
- Medical Group Management Association: Cost Survey for Hematology/Oncology Practices: 2004 Report Based on 2003 Data. Englewood, CO, Medical Group Management Association, 2004
LinkOut - more resources
Full Text Sources