

Parallel evolution in Pseudomonas aeruginosa over 39,000 generations in vivo
- PMID: 20856824
- PMCID: PMC2939680
- DOI: 10.1128/mBio.00199-10
Parallel evolution in Pseudomonas aeruginosa over 39,000 generations in vivo
Abstract
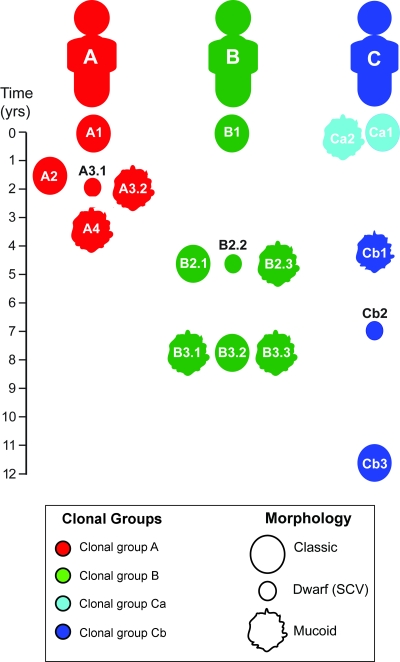
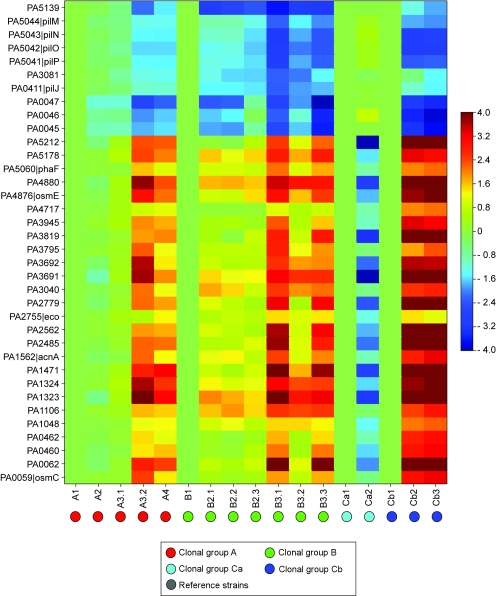
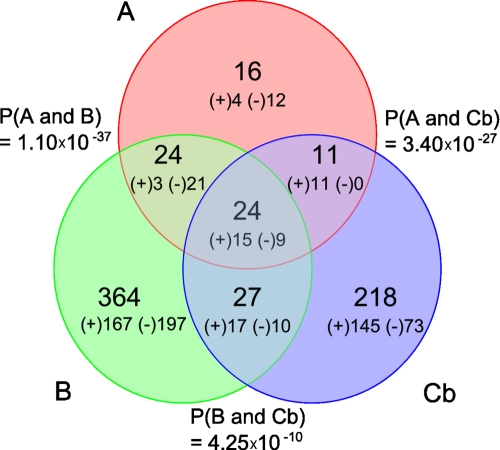
The Gram-negative bacterium Pseudomonas aeruginosa is a common cause of chronic airway infections in individuals with the heritable disease cystic fibrosis (CF). After prolonged colonization of the CF lung, P. aeruginosa becomes highly resistant to host clearance and antibiotic treatment; therefore, understanding how this bacterium evolves during chronic infection is important for identifying beneficial adaptations that could be targeted therapeutically. To identify potential adaptive traits of P. aeruginosa during chronic infection, we carried out global transcriptomic profiling of chronological clonal isolates obtained from 3 individuals with CF. Isolates were collected sequentially over periods ranging from 3 months to 8 years, representing up to 39,000 in vivo generations. We identified 24 genes that were commonly regulated by all 3 P. aeruginosa lineages, including several genes encoding traits previously shown to be important for in vivo growth. Our results reveal that parallel evolution occurs in the CF lung and that at least a proportion of the traits identified are beneficial for P. aeruginosa chronic colonization of the CF lung.
Figures
Similar articles
-
Pseudomonas aeruginosa enhances production of a non-alginate exopolysaccharide during long-term colonization of the cystic fibrosis lung.PLoS One. 2013 Dec 6;8(12):e82621. doi: 10.1371/journal.pone.0082621. eCollection 2013. PLoS One. 2013. PMID: 24324811 Free PMC article.
-
Genomic and Functional Characterization of Longitudinal Pseudomonas aeruginosa Isolates from Young Patients with Cystic Fibrosis.Microbiol Spectr. 2023 Aug 17;11(4):e0155623. doi: 10.1128/spectrum.01556-23. Epub 2023 Jun 26. Microbiol Spectr. 2023. PMID: 37358436 Free PMC article.
-
Genetic adaptation of Pseudomonas aeruginosa during chronic lung infection of patients with cystic fibrosis: strong and weak mutators with heterogeneous genetic backgrounds emerge in mucA and/or lasR mutants.Microbiology (Reading). 2010 Apr;156(Pt 4):1108-1119. doi: 10.1099/mic.0.033993-0. Epub 2009 Dec 17. Microbiology (Reading). 2010. PMID: 20019078
-
Microevolution of Pseudomonas aeruginosa to a chronic pathogen of the cystic fibrosis lung.Curr Top Microbiol Immunol. 2013;358:91-118. doi: 10.1007/82_2011_199. Curr Top Microbiol Immunol. 2013. PMID: 22311171 Review.
-
Pseudomonas aeruginosa adaptation and evolution in patients with cystic fibrosis.Nat Rev Microbiol. 2021 May;19(5):331-342. doi: 10.1038/s41579-020-00477-5. Epub 2020 Nov 19. Nat Rev Microbiol. 2021. PMID: 33214718 Review.
Cited by
-
Tangled bank of experimentally evolved Burkholderia biofilms reflects selection during chronic infections.Proc Natl Acad Sci U S A. 2013 Jan 15;110(3):E250-9. doi: 10.1073/pnas.1207025110. Epub 2012 Dec 27. Proc Natl Acad Sci U S A. 2013. PMID: 23271804 Free PMC article.
-
Challenges in using transcriptome data to study the c-di-GMP signaling network in Pseudomonas aeruginosa clinical isolates.FEMS Microbes. 2023 Jul 18;4:xtad012. doi: 10.1093/femsmc/xtad012. eCollection 2023. FEMS Microbes. 2023. PMID: 37564278 Free PMC article.
-
The distribution of bacterial doubling times in the wild.Proc Biol Sci. 2018 Jun 13;285(1880):20180789. doi: 10.1098/rspb.2018.0789. Proc Biol Sci. 2018. PMID: 29899074 Free PMC article.
-
Development of an ex vivo porcine lung model for studying growth, virulence, and signaling of Pseudomonas aeruginosa.Infect Immun. 2014 Aug;82(8):3312-23. doi: 10.1128/IAI.01554-14. Epub 2014 May 27. Infect Immun. 2014. PMID: 24866798 Free PMC article.
-
Too much of a good thing: the unique and repeated paths toward copper adaptation.Genetics. 2015 Feb;199(2):555-71. doi: 10.1534/genetics.114.171124. Epub 2014 Dec 17. Genetics. 2015. PMID: 25519894 Free PMC article.
References
-
- Elena S. F., Lenski R. E. 2003. Evolution experiments with microorganisms: the dynamics and genetic bases of adaptation. Nat. Rev. Genet. 4:457–469 - PubMed
-
- Worlitzsch D., Tarran R., Ulrich M., Schwab U., Cekici A., Meyer K. C., Birrer P., Bellon G., Berger J., Weiss T., Botzenhart K., Yankaskas J. R., Randell S., Boucher R. C., Doring G. 2002. Effects of reduced mucus oxygen concentration in airway Pseudomonas infections of cystic fibrosis patients. J. Clin. Invest. 109:317–325 - PMC - PubMed
Publication types
MeSH terms
Substances
Associated data
- Actions
Grants and funding
LinkOut - more resources
Full Text Sources
Other Literature Sources
Medical
Molecular Biology Databases
