. 2010 Sep 14;5(9):e12712.
doi: 10.1371/journal.pone.0012712.

MnSOD upregulation induces autophagic programmed cell death in senescent keratinocytes

Affiliations

MnSOD upregulation induces autophagic programmed cell death in senescent keratinocytes

Emeric Deruy et al. PLoS One. .

Abstract

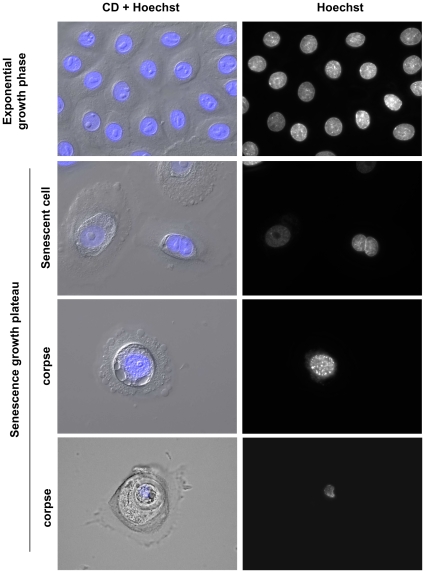
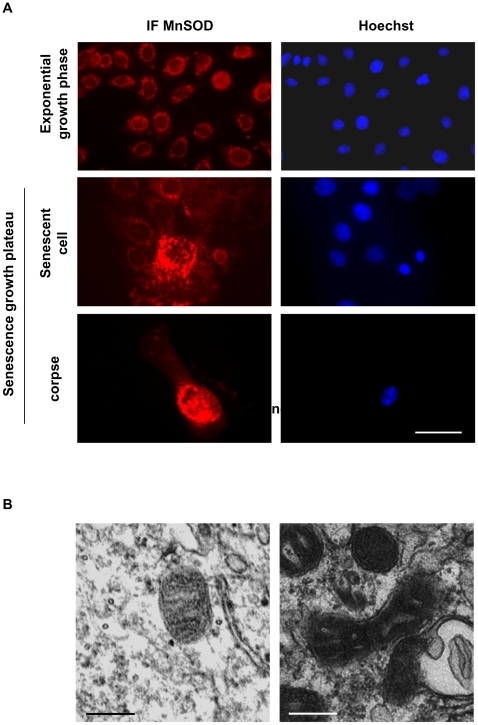
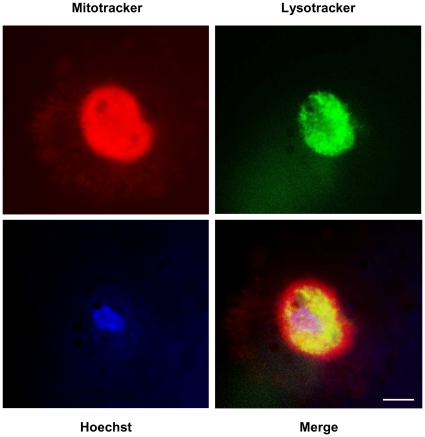
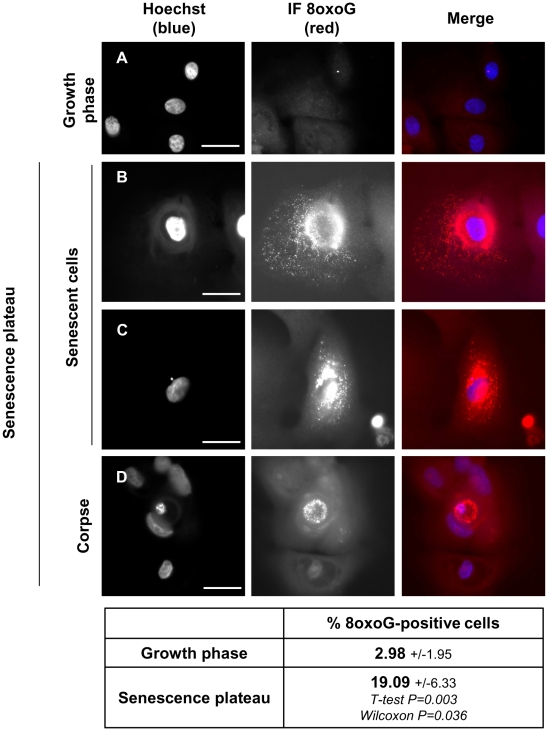
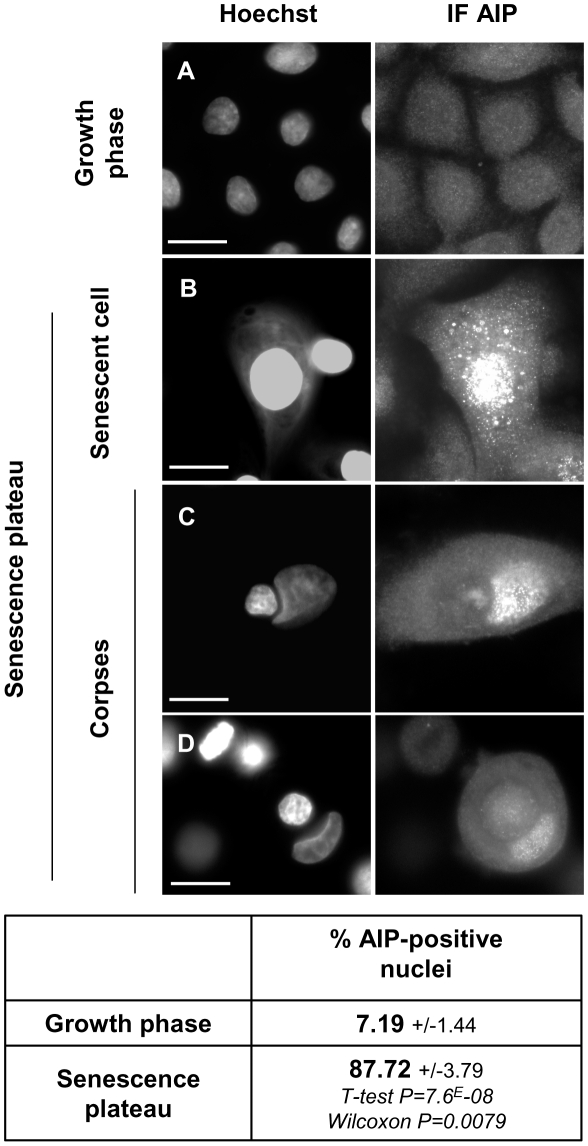
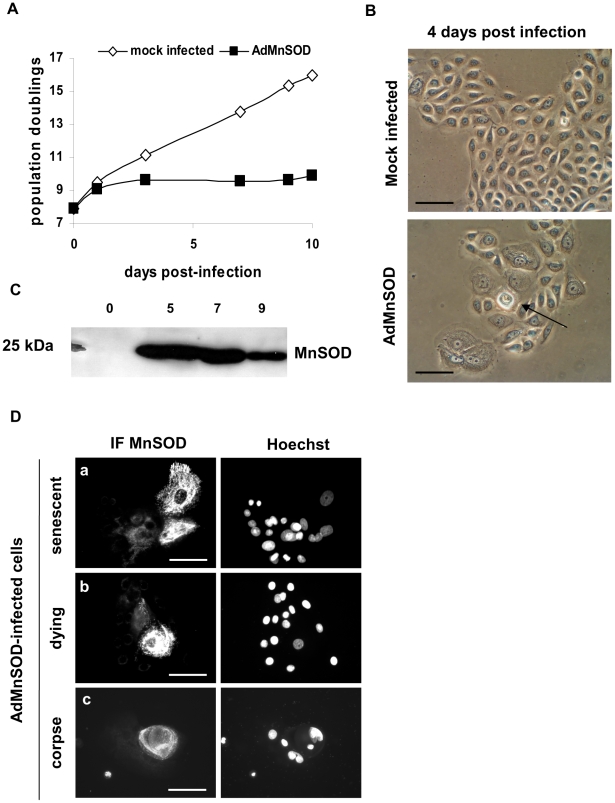
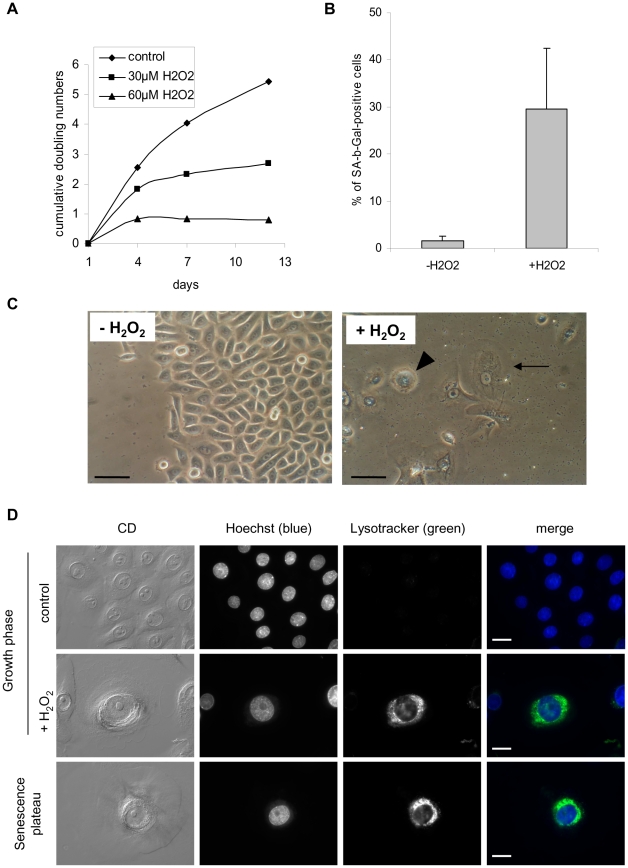
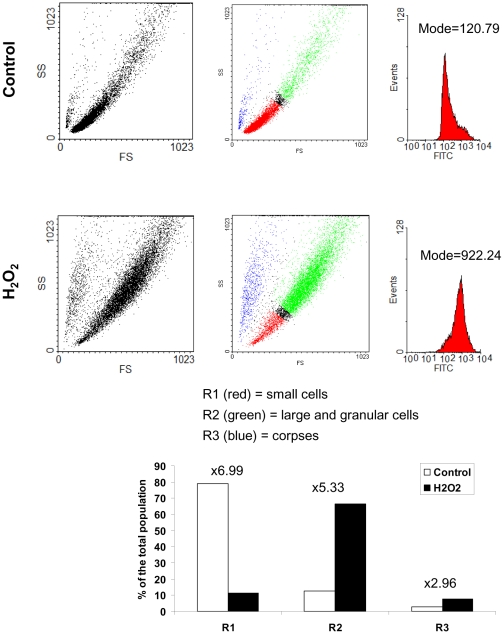
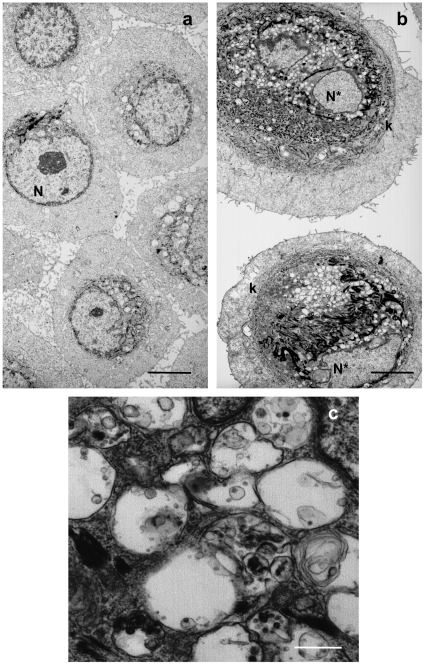
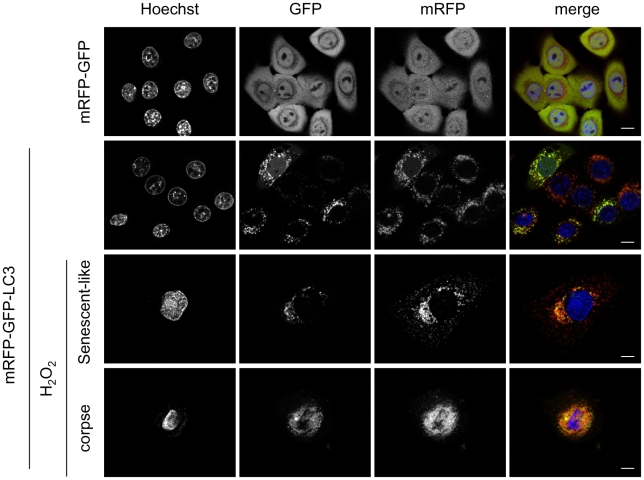
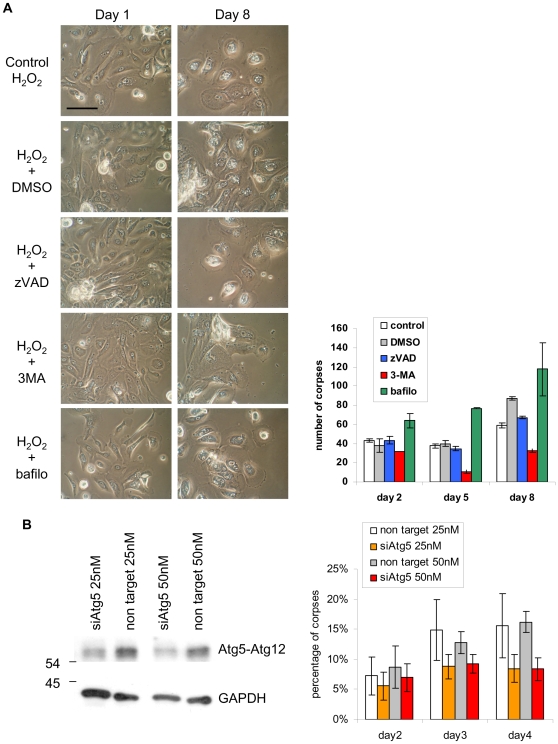
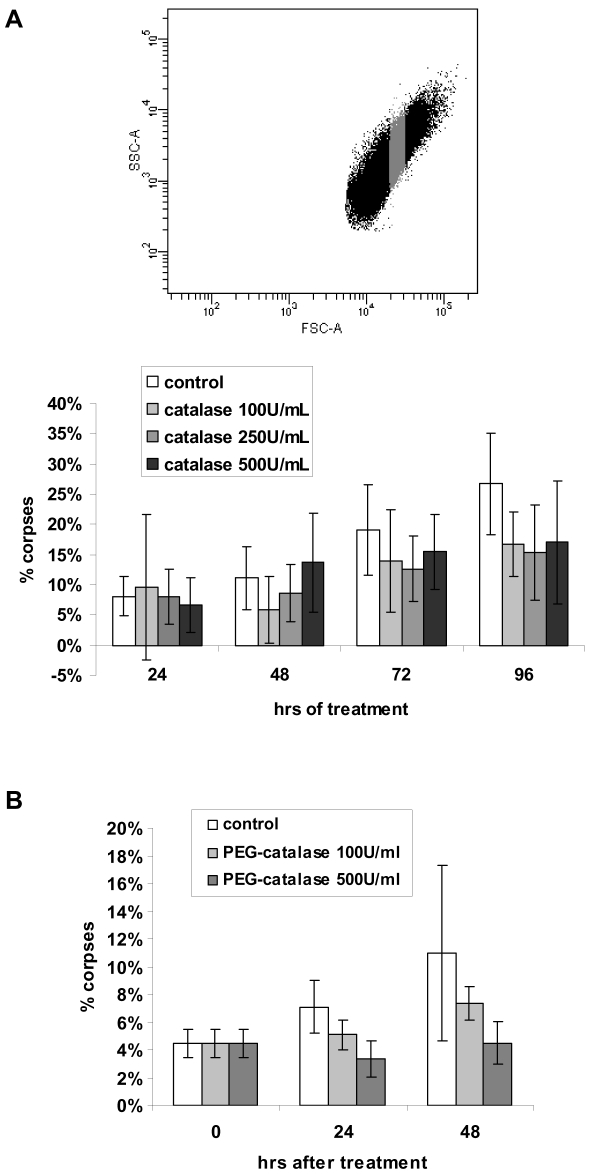
Senescence is a state of growth arrest resulting mainly from telomere attrition and oxidative stress. It ultimately leads to cell death. We have previously shown that, in keratinocytes, senescence is induced by NF-kappaB activation, MnSOD upregulation and H(2)O(2) overproduction. We have also shown that senescent keratinocytes do not die by apoptosis but as a result of high macroautophagic activity that targets the primary vital cell components. Here, we investigated the mechanisms that activate this autophagic cell death program. We show that corpses occurring at the senescence plateau display oxidatively-damaged mitochondria and nucleus that colocalize with autophagic vacuoles. The occurrence of such corpses was decreased by specifically reducing the H(2)O(2) level with catalase, and, conversely, reproduced by overexpressing MnSOD or applying subtoxic doses of H(2)O(2). This H(2)O(2)-induced cell death did occur through autophagy since it was accompanied by an accumulation of autophagic vesicles as evidenced by Lysotracker staining, LC3 vesiculation and transmission electron microscopy. Most importantly, it was partly abolished by 3-methyladenine, the specific inhibitor of autophagosome formation, and by anti-Atg5 siRNAs. Taken together these results suggest that autophagic cell death is activated in senescent keratinocytes because of the upregulation of MnSOD and the resulting accumulation of oxidative damages to nucleus and mitochondria.


Conflict of interest statement

Competing Interests: The authors have declared that no competing interests exist.

Figures

Figure 1
Figure 1. Nuclear damages in senescent keratinocytes and corpses.
NHEKs at the exponential growth phase or at the senescence growth plateau were fixed, stained with Hoechst and observed under circular dichroism plus epifluorescent microscopy. Senescent keratinocytes display altered chromatin and are often polynucleated. Corpses are characterized by the presence of a central area always containing a much damaged nucleus. Images are representative of all the senescent cells and corpses visible at the senescence plateau of different cell donors. Scale bar = 20 µM.
Figure 2
Figure 2. Mitochondrial damages in senescent keratinocytes and corpses.
(A) NHEKs at the exponential growth phase or at the senescence plateau were immunostained with anti MnSOD antibodies. In almost all senescent cells, the stained structures (the mitochondria) are vesiculated and agglutinated in the vicinity of the nucleus. In corpses, the stained structures are concentrated in the central area which also contains the altered nucleus. Scale bars = 40 µM. (B) NHEKs at the exponential growth phase or at the senescence plateau were trypsinized and prepared for transmission electron microscopy. Details of mitochondrial morphology are shown. In young cells at the exponential growth phase, mitochondria have a normal morphology, whereas those of senescent cells display very dark and thickened cristae. Scale bars = 0.25 µM.
Figure 3
Figure 3. Corpses contain a central area in which mitochondria, nucleus and acidic vacuoles are colocalized.
NHEKs at the senescence plateau were triply stained with Mitotracker (red), to stain mitochondria, Lysotracker (green), to stain the acidic organelles (including autophagic vacuoles), and Hoechst (blue) to stain nuclei. A representative image of the staining of corpses is given at high magnification (scale bar = 20 µm). The three stainings co-localize within a central area. The rest of the cell, visible as background in the Mitotracker image, is devoided of any mitochondria or acidic organelles. Note that the Lysotracker staining is vesiculated, as expected, and that the nucleus of the corpse is much damaged.
Figure 4
Figure 4. Mitochondria and nuclei of senescent keratinocytes and corpses contain oxidized guanines.
NHEKs at the exponential growth phase or at the senescence plateau were processed for immunodetection of 8-oxo-guanines (8oxoG). Different representative images are given. Young cells at the growth phase are negative for 8oxoG (A). Cells at the senescence plateau display different staining patterns, according to their degree of damaging. In senescent cells not much damaged, 8oxoG are mainly localized on punctuated cytoplasmic structures, probably mitochondria (B). When the nucleus is damaged (as indicated by the presence of a micronucleus), 8oxoG are localized inside the nucleus and on punctuated cytoplasmic structures aggregated in the vicinity of the nucleus (C). When the cell is obviously dead and display a very much damaged nucleus inside the central area and another one pushed away by it, 8oxoG are localized inside the central area, inside the nucleus itself as well as inside other punctuated structures (D). Scale bars = 30 µm. The number of 8oxoG-positive cells (including corpses) was manually counted in 5 random microscopic fields amongst a total of 617 young or 123 senescent cells. Values are the mean percentages of 8-oxoG-positive cells +/− SD. Since the data are not strictly normally distributed, P values were calculated using both Student and Wilcoxon tests.
Figure 5
Figure 5. Mitochondria and nuclei of senescent keratinocytes and corpses contain oxidized lipids and proteins.
NHEKs at the exponential growth phase or at the senescence plateau were processed for immunodetection of amino-imino-propene bridges (AIP). Young cells at the growth phase are negative for AIP (A). In senescent cells and corpses, AIP are found mainly in the nucleus and in some punctuated cytoplasmic structures (B and C). When the nucleus is localized in the autophagic central area, the staining disappears (C and D). Scale bars = 30 µm. The number of cells (including corpses) with AIP-positive nuclei was manually counted in 5 random microscopic fields amongst a total of 2068 young and 1040 senescent cells. Values are the mean percentages of cells with AIP-positive nuclei +/− SD. Since the data are not strictly normally distributed, P values were calculated using both Student and Wilcoxon tests.
Figure 6
Figure 6. Overexpression of MnSOD induces premature senescence and autophagic cell death.
NHEKs at the exponential growth phase were infected or not with an adenovirus encoding MnSOD (AdMnSOD) by directly adding virus particles in the culture medium at an input multiplicity of 200 viral particles/cell. (A) Growth curve of control and infected cultures. (B) Observation by phase contrast microscopy of the morphology of control and infected cells. Note that almost 100% of infected cells display a senescent-like morphology with spreading and polynucleation. One cell in the centre of the field resembles an autophagic corpse with a refringent central area (arrow). (C) Control of MnSOD expression in infected cells by western-blotting. (D) Immunofluorescence against MnSOD on AdMnSOD-infected cells. Amongst cells of an islet, cells expressing MnSOD at the highest level have either a marked senescent phenotype (a), a dying phenotype (b) or are already a corpse (c). Scale bars = 40 µM.
Figure 7
Figure 7. H2O2 induces premature senescence and signs of autophagic cell death.
(A) NHEKs at the exponential growth phase were treated or not with 30 or 60 µM H2O2 for 2 hrs every 72 hrs. Cells were counted at different time points during the treatment in four independent wells, and the cumulative numbers of doublings were calculated using the mean of cell counts. (B) SA-beta-Gal assays were performed on control and 30 µM H2O2-treated cells at day 8. SA-beta-Gal-positive cells were counted in 4 microscopic fields. Results are given as means +/− SD of all field counts. Since the data are not strictly normally distributed, P values were calculated using both Student and Wilcoxon tests. They respectively equal 0.03 and 0.028. (C) Cells were observed under phase contrast microscopy. The images illustrate control and 30 µM H2O2-treated cell morphologies at day 8. Note the presence in H2O2-treated cultures of large senescent cells (arrow) and corpses (arrowhead). Scale bars = 20 µM. (D) NHEKs at the exponential growth phase were treated with 50 µM H2O2 and analyzed three days later by Lysotracker staining and microscopic analysis in comparison with cells at a normal senescence plateau. The corpses induced by the H2O2 treatment were similar to the normal ones occurring at the senescence plateau regarding their morphology under circular dichroism (CD) and their Lysotracker staining. The Lysotracker staining concentrates in the central area of corpses. Scale bars = 30 µM.
Figure 8
Figure 8. Quantification of the effect of the H2O2-treatement by flow cytometry and Lysotracker staining.
NHEKs at the exponential growth phase were treated with 50 µM H2O2 and analyzed three days later by Lysotracker staining. (Left panel) Flow cytometry analysis of the cell population plot for forward factor (FS, indicative of size, in X) and side scatter factor (SS, indicative of granularity, in Y). (Middle panel) Quantitative analysis of the evolution of the subpopulations upon the H2O2 treatment using the WinMDI software. (Right panel) Measure of the intensity of the Lysotracker staining (FITC, in X) of the all population. The mode values of the fluorescence intensity are given.
Figure 9
Figure 9. Ultrastructure of H2O2-induced senescent cells.
NHEKs at the growth phase were treated with 50 µM H2O2 and processed 72 hrs later for transmission electron microscopy. (a) Control non treated cells. (b) H2O2-treated cells. N: nucleus, N*: deformed nucleus with less heterochromatin, k: cytokeratin network encircling the nucleus and the autophagic vacuoles. Scale bars = 5 µM. (c) Detail of autophagic vacuoles found in H2O2-treated cells. Scale bars = 0.4 µM.
Figure 10
Figure 10. H2O2-induced senescent cells and corpses display a high and fully active autophagic flux.
NHEKs at the exponential growth phase were treated or not twice with 50 µM H2O2 at 48 hrs interval and transfected with either the mRFP-GFP-LC3 or the control vector mRFP-GFP devoided of LC3. Forty eight hrs later, cells were analyzed under a confocal microscope. Non treated cells transfected with the control vector display a homogenous green (GFP) and red (mRFP) fluorescence. Non treated cells transfected by the mRFP-GFP-LC3 vector display some red and green vesicles. H2O2-treated cells transfected by the mRFP-GFP-LC3 vector display senescent or corpse features, with damaged nuclei and numerous vesicles whose majority are redder than green. In corpses, the vesicles are concentrated in the central area. Scale bars = 10 µM.
Figure 11
Figure 11. Inhibiting autophagy, but not apoptosis, delays the death of H2O2-induced senescent cells.
(A) NHEKs at the exponential growth phase were treated by 50 µM H2O2 until almost 100% cells were senescent (after 48 hrs). Then, cells were either kept untreated for control, or treated by 3-MA at 5 mM, z-VAD at 20 µM, Bafilomycine A1 at 5 nM or DMSO, the diluent of z-VAD and Bafilomycine A1. Forty eight hours later, the H2O2-treatment followed by the inhibitor treatment was repeated a second time. (Upper panel) Cells morphologies observed under a phase-contrast microscope at different time points after the beginning of the inhibitor treatment. Scale bar = 50 µm. (Lower panel) The number of typical corpses with a refringent central area was counted under microscopic observation at the indicated time points after the beginning of the inhibitor treatment. The counts were performed in 20 microscopic fields of two independent culture dishes, each field comprising about 300 cells. The given results are the mean +/− standard deviation of all counts. Since the data are not strictly normally distributed, P values were calculated using both Student and Wilcoxon tests. The results are given Figure S6. This experiment is representative of two independent ones. (B) NHEKs at the exponential growth phase were treated twice by 50 µM H2O2 at 24 hrs interval until almost 100% cells were senescent (after 48 hrs). Then, cells were either transfected by anti-Atg5 siRNAs at 25 or 50 nM or by non target siRNAs at 25 or 50 nM. (Left panel) Western-blot analysis of Atg5 expression at day 4 after transfection. The antiAtg5 antibody recognizes the Atg5-Atg12 conjugate. (Right panel) The number of typical corpses with a refringent central area was counted under microscopic observation at the indicated time points after transfection. The counts were performed in 10 microscopic fields, each field comprising about 100 cells. The given results are the mean +/− standard deviation of all counts. Since the data are not strictly normally distributed, P values were calculated using both Student and Wilcoxon tests. The results are given Figure S6. This experiment is representative of three independent ones.
Figure 12
Figure 12. Enhancing H2O2 degradation delays senescent-cell death.
(A) NHEKs at the senescence growth plateau were analyzed by flow cytometry according to size (FSC in X) and granularity (SSC in Y) and the subpopulation of still viable senescent cells (in grey) was sorted. Sorted cells were plated in 6-wells plates at 30.000 cells per well and treated or not by catalase at different concentrations. The medium +/− catalase was renewed every 24 hrs. The number of typical corpses with a refringent central area was counted under microscopic observation every day. The counts were performed in 12 microscopic fields in three independent culture wells, each field comprising about 10 cells. The given results are the mean +/− standard deviation of all counts. Since the data are not strictly normally distributed, P values were calculated using both Student and Wilcoxon tests. The results are given Figure S6. This experiment is representative of two independent ones. (B) NHEKs at the senescence growth plateau were plated in 6-wells plates at 500.000 cells per well and treated or not by PEG-catalase at different concentrations. The number of typical corpses with a refringent central area was counted under microscopic observation every day. The counts were performed in 6 microscopic fields comprising about 100 cells. The given results are the mean +/− standard deviation of all counts. Since the data are not strictly normally distributed, P values were calculated using both Student and Wilcoxon tests. The results are given Figure S6. This experiment is representative of two independent ones.

Similar articles

Cited by

References

    1. Hayflick L. The limited in vitro lifetime of human diploid cell strains. Exp Cell Res. 1965;37:614–636. - PubMed
    1. Cristofalo VJ, Lorenzini A, Allen RG, Torres C, Tresini M. Replicative senescence: a critical review. Mech Ageing Dev. 2004;125:827–48. - PubMed
    1. Zwerschke W, Mazurek S, Stockl P, Hutter E, Eigenbrodt E, et al. Metabolic analysis of senescent human fibroblasts reveals a role for AMP in cellular senescence. Biochem J. 2003;376:403–11. - PMC - PubMed
    1. Gosselin K, Deruy E, Martien S, Vercamer C, Bouali F, et al. Senescent keratinocytes die by autophagic programmed cell death. Am J Pathol. 2009;174:423–35. - PMC - PubMed
    1. Young AR, Narita M, Ferreira M, Kirschner K, Sadaie M, et al. Autophagy mediates the mitotic senescence transition. Genes Dev. 2009;23:798–803. - PMC - PubMed

Publication types