. 2010 Sep 14;5(9):e12727.
doi: 10.1371/journal.pone.0012727.

Epigenetic mechanisms regulate stem cell expressed genes Pou5f1 and Gfra1 in a male germ cell line

Affiliations

Epigenetic mechanisms regulate stem cell expressed genes Pou5f1 and Gfra1 in a male germ cell line

Maren Godmann et al. PLoS One. .

Abstract

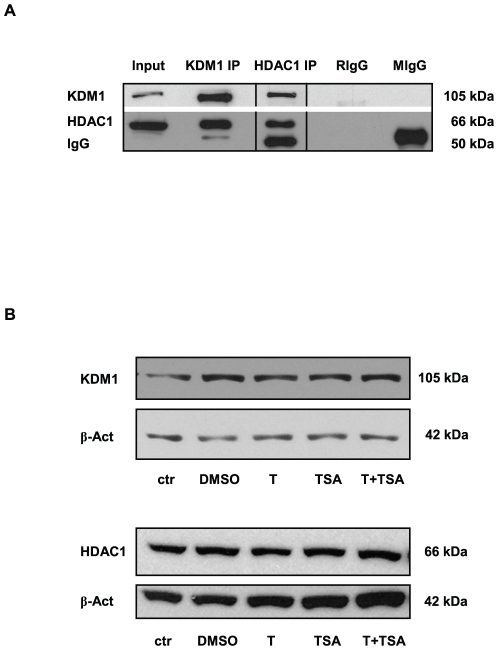
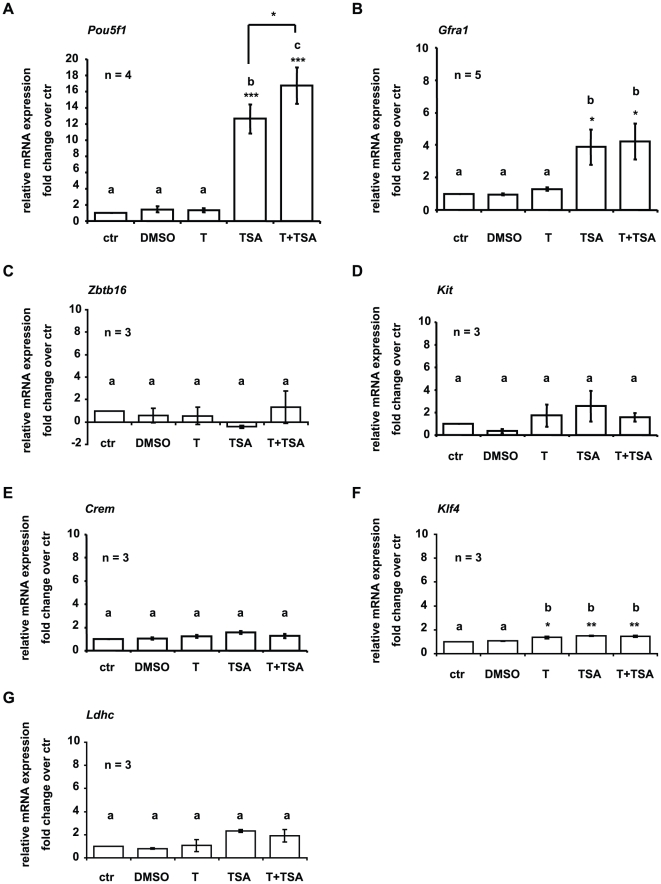
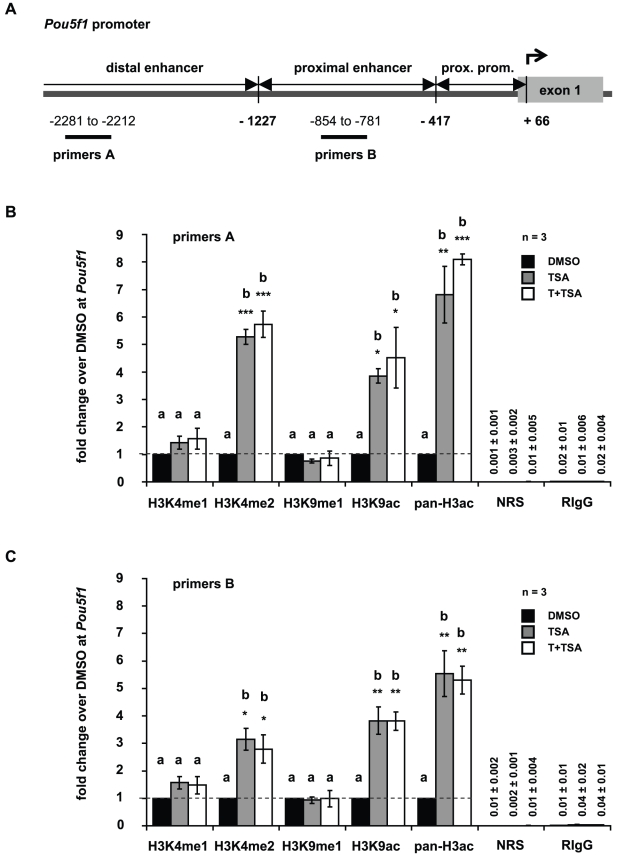
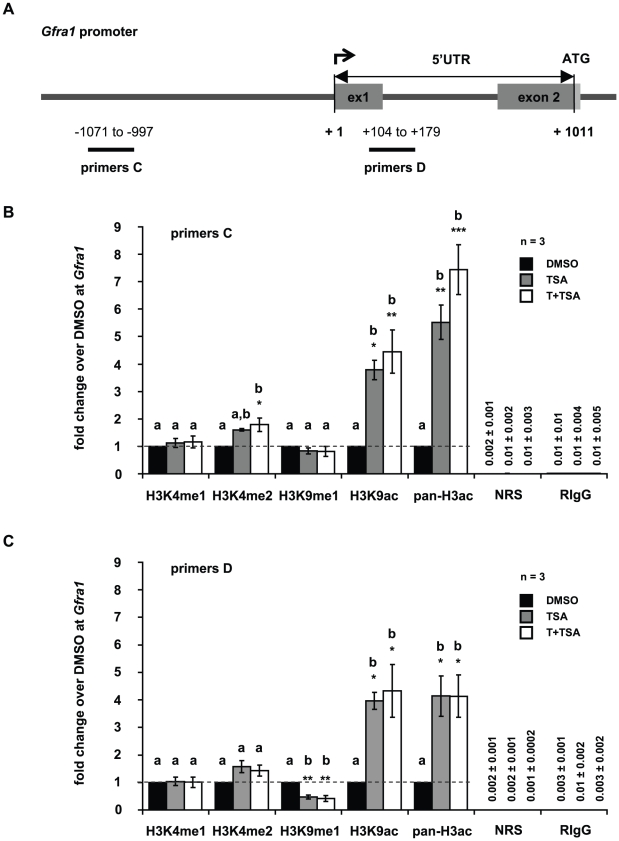
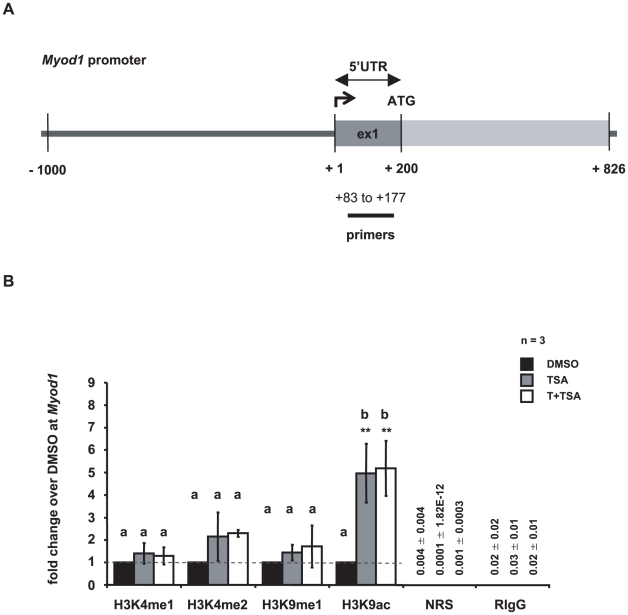
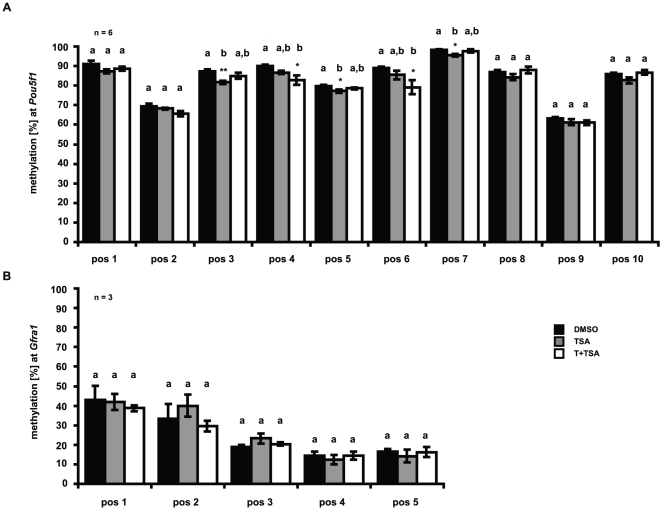
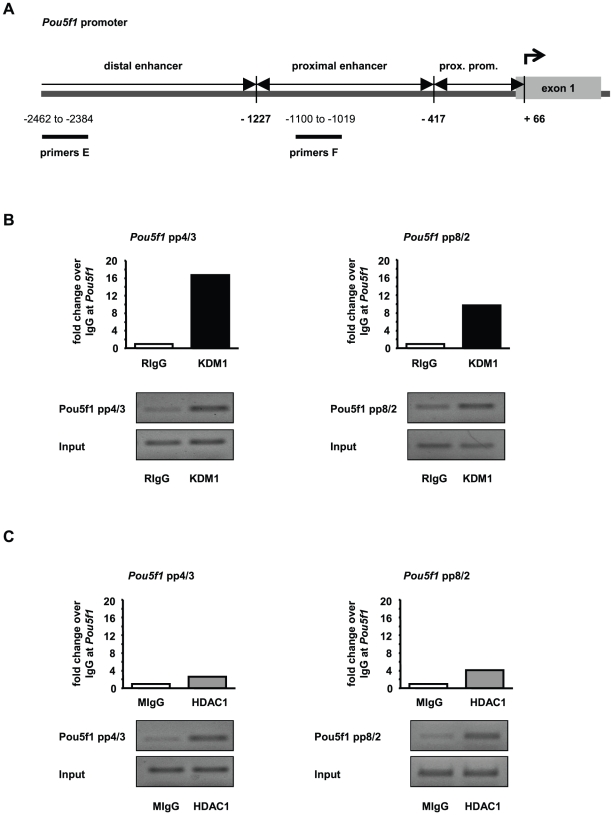
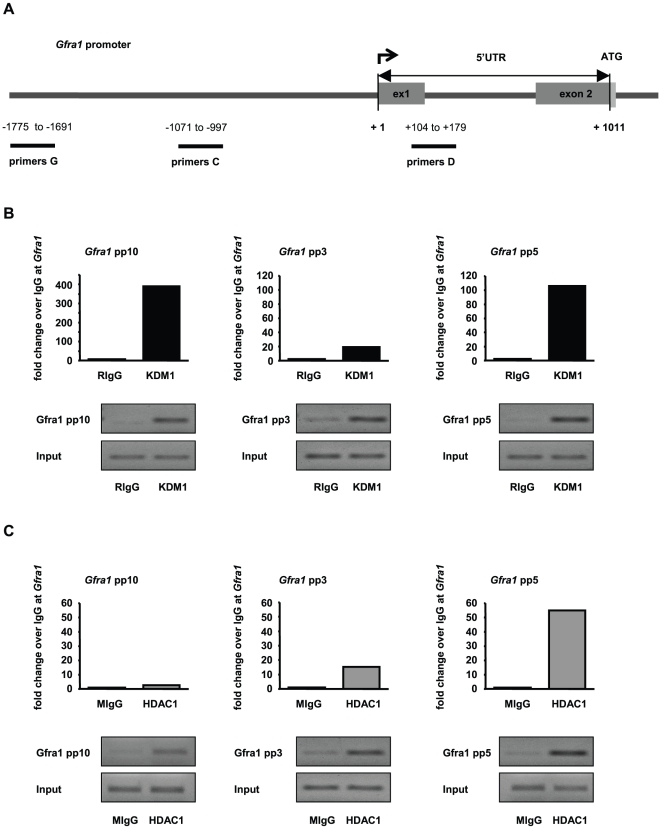
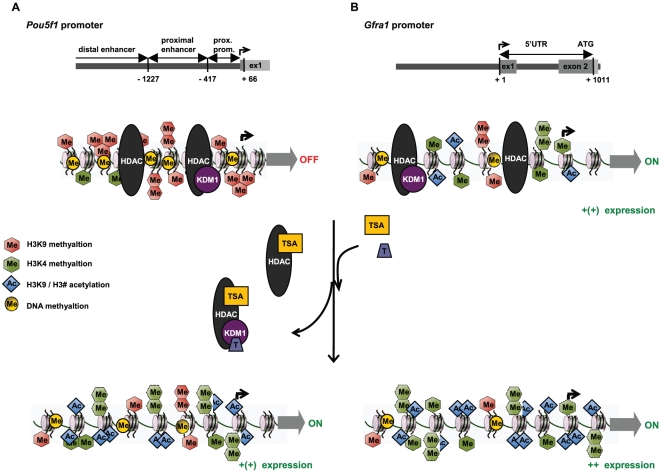
Male fertility is declining and an underlying cause may be due to environment-epigenetic interactions in developing sperm, yet nothing is known of how the epigenome controls gene expression in sperm development. Histone methylation and acetylation are dynamically regulated in spermatogenesis and are sensitive to the environment. Our objectives were to determine how histone H3 methylation and acetylation contribute to the regulation of key genes in spermatogenesis. A germ cell line, GC-1, was exposed to either the control, or the chromatin modifying drugs tranylcypromine (T), an inhibitor of the histone H3 demethylase KDM1 (lysine specific demethylase 1), or trichostatin (TSA), an inhibitor of histone deacetylases, (HDAC). Quantitative PCR (qPCR) was used to identify genes that were sensitive to treatment. As a control for specificity the Myod1 (myogenic differentiation 1) gene was analyzed. Chromatin immunoprecipitation (ChIP) followed by qPCR was used to measure histone H3 methylation and acetylation at the promoters of target genes and the control, Myod1. Remarkably, the chromatin modifying treatment specifically induced the expression of spermatogonia expressed genes Pou5f1 and Gfra1. ChIP-qPCR revealed that induction of gene expression was associated with a gain in gene activating histone H3 methylation and acetylation in Pou5f1 and Gfra1 promoters, whereas CpG DNA methylation was not affected. Our data implicate a critical role for histone H3 methylation and acetylation in the regulation of genes expressed by spermatogonia--here, predominantly mediated by HDAC-containing protein complexes.


Conflict of interest statement

Competing Interests: The authors have declared that no competing interests exist.

Figures

Figure 1
Figure 1. KDM1 and HDAC1 form heteromeric complexes in GC-1 cells.
(A) Endogenous KDM1 and HDAC1 were co-immunoprecipitated with specific antibodies against KDM1 and HDAC1. Total GC-1 protein extract was used as input control. Immunoglobulin G (IgG), Rabbit IgG (RIgG), mouse IgG (MIgG). (B) Western blot analyses of HDAC1 and KDM1 in protein extracts isolated from GC-1 cells grown in culture medium (control, ctr), or in culture medium containing either dimethylsulphoxide (DMSO; TSA solvent), or tranylcypromine (T), or trichostatin A (TSA), or tranylcypromine and TSA (T+TSA). Western blots were reprobed with an antibody against beta-Actin as a loading control. Treatment of GC-1 cells with tranylcypromine and TSA does not alter protein levels of KDM1 and HDAC1.
Figure 2
Figure 2. Treatment induces Pou5f1 and Gfra1 gene expression in GC-1 cells.
QPCR analyses of spermatogenic gene expression in GC-1 cells, either grown in culture medium (control, ctr), or treated with tranylcypromine (T), or trichostatin A (TSA), or dimethylsulphoxid (DMSO; TSA solvent), or tranylcypromine and TSA (T+TSA). To avoid detection of expressed pseudogenes a TaqMan assay was performed to analyze Pou5f1 gene expression. Pou5f1 signals were normalized to 18S rRNA. All other genes were analyzed using SYBR green and signals were normalized to Gapdh. Values shown on the graphs are based on the change in expression in treated cells compared to the level of expression in control cells whereby the level of expression in control cells was defined as one. Thereby the fold change in expression indicates the ratio of normalized target gene expression in treated cells over normalized target gene expression in control cells. Data are expressed as mean ± SEM; *p<0.05, **p<0.01, ***p<0.001. Means with different letters are significantly different. N indicates the number of independent experiments, and per experiment each sample and the corresponding negative controls were run in triplicates. Trichostatin A treatment triggers Pou5f1 (A) and Gfra1 (B) gene expression in GC-1 cells. Treatment causes a slight but significant increase in Krueppel-like factor 4 (Klf4) (F) expression. Zinc finger and BTB domain containing 16 (Zbtb16) (C), kit oncogene (Kit) (D), cAMP responsive element modulator (Crem) (E), and lactate dehydrogenase C (Ldhc) (G) are not affected by treatment.
Figure 3
Figure 3. Tranylcypromine and trichostatin A treatment influences posttranslational modifications of histone H3 at Pou5f1 promoter.
(A) Schematic representation of the Pou5f1 promoter. Numbers depict the positions of primer pairs used for ChIP-qPCR relative to the corresponding transcriptional start site. (B,C) Analyses of histone H3 methylation and acetylation levels in the Pou5f1 promoter by ChIP followed by qPCR in GC-1 cells that have been cultured in the presence of dimethylsulphoxide (DMSO, control, black bars), or trichostatin A (TSA, grey bars), or both inhibitors, tranylcypromine and TSA (T+TSA, white bars). Signals of target DNA received from DMSO control cells served as base and were defined as one. Fold change indicates 2∧-(ΔΔCT) of target DNA in treated cells over 2∧-(ΔΔCT) of target DNA in DMSO controls (Y-axis). Epigenetic modifications are depicted on the X-axis. Data are expressed as mean ± SEM; *p<0.05, **p<0.01, ***p<0.001. Means with different letters are significantly different. N indicates the number of independent experiments, and per experiment each sample and the corresponding negative controls were run in triplicates.
Figure 4
Figure 4. Tranylcypromine and trichostatin A treatment influences posttranslational modifications of histone H3 at Gfra1 promoter.
(A) Schematic representation of the Gfra1 promoter. Numbers depict the positions of primer pairs used for ChIP-qPCR relative to the corresponding transcriptional start site. (B,C) Analyses of histone H3 methylation and acetylation levels in the Gfra1 promoter by ChIP and qPCR in GC-1 cells that have been cultured in the presence of dimethylsulphoxide (DMSO, control, black bars), or trichostatin A (TSA, grey bars), or both inhibitors, tranylcypromine and TSA (T+TSA, white bars). Signals of target DNA received from DMSO control cells served as base and were defined as one. Fold change indicates 2∧-(ΔΔCT) of target DNA in treated cells over 2∧-(ΔΔCT) of target DNA in DMSO controls (Y-axis). Epigenetic modifications are depicted on the X-axis. Data are expressed as mean ± SEM; *p<0.05, **p<0.01, ***p<0.001. Means with different letters are significantly different. N indicates the number of independent experiments, and per experiment each sample and the corresponding negative controls were run in triplicates.
Figure 5
Figure 5. Histone H3 methylation at Myod1 promoter is not affected by tranylcypromine and trichostatin A treatment.
(A) Schematic representation of the Myod1 promoter. Numbers depict the positions of primers used for ChIP-qPCR relative to the corresponding transcriptional start site. (B) ChIP analyses followed by qPCR reveal changes in the epigenetic landscape of the Myod1 promoter upon treatment. Despite the increase in H3K9 acetylation, Myod1 is not expressed in untreated GC-1 cells nor induced as a consequence of treatment, as shown in Table S4. Depicted are histone H3 methylation and acetylation levels in GC-1 cells that have been cultured in the presence of dimethylsulphoxide (DMSO, control, black bars), or trichostatin A (TSA, grey bars), or both inhibitors, tranylcypromine and TSA (T+TSA, white bars). Signals of target DNA received from DMSO control cells served as base and were defined as one. Fold change indicates 2∧-(ΔΔCT) of target DNA in treated cells over 2∧-(ΔΔCT) of target DNA in DMSO controls (Y-axis). Epigenetic modifications are depicted on the X-axis. Data are expressed as mean ± Stdev; *p<0.05, **p<0.01. Means with different letters are significantly different. N indicates the number of independent experiments, and per experiment each sample and the corresponding negative controls were run in triplicates.
Figure 6
Figure 6. Effect of tranylcypromine and trichostatin A treatment on CpG methylation at Pou5f1 and Gfra1 promoters.
DNA was extracted, treated with bisulfite, amplified by PCR and pyrosequencing was used to determine the bisulfite-converted sequence of CpG sites in (A) Pou5f1 (positions −190 to +26 relative to the transcriptional start site) and (B) Gfra1 promoters (positions +26 to +143 relative to the transcriptional start site). The methylation status of each position is depicted as the mean percentage of “n” independent experiments ± SEM; *p<0.05, **p<0.01. Means with different letters are significantly different. Black bars indicate DMSO controls, grey bars depict TSA treated samples and white bars represent samples that have been exposed to both inhibitors, tranylcypromine and TSA (T+TSA).
Figure 7
Figure 7. KDM1- and HDAC1-containing protein complexes are located at the Pou5f1 promoter in GC-1 cells.
(A) Schematic representation of the Pou5f1 promoter. Numbers depict the positions of primer pairs used for ChIP-qPCR relative to the corresponding transcriptional start site. (B,C) ChIP-qPCRs demonstrate occupancy of the Pou5f1 promoter by KDM1- (B) and HDAC1-containing protein complexes (C). ChIP assays were performed on GC-1 cells that have been cultured in the presence of dimethylsulphoxide using either a specific antibody (recognizing either KDM1 (black bars) or HDAC1 (grey bars)) or the corresponding IgG controls (white bars), (rabbit IgG  =  RIgG; mouse IgG  =  MIgG). Each bar represents the ChIP-qPCR results of two independent, pooled experiments. Signals of target DNA received from IgG controls served as base and were defined as one. Fold change represents the 2∧-(ΔΔCT) value, where the normalized IgG signal is subtracted from the normalized signal of the specific antibody. QPCR results were analyzed on an agarose gel and shown underneath the corresponding graphs.
Figure 8
Figure 8. KDM1- and HDAC1-containing protein complexes are located at the Gfra1 promoter in GC-1 cells.
(A) Schematic representation of the Gfra1 promoter. Numbers depict the positions of primer pairs used for ChIP-qPCR relative to the corresponding transcriptional start site. (B,C) ChIP-qPCRs demonstrate occupancy of the Gfra1 promoter by KDM1- (B) and HDAC1-containing protein complexes (C). ChIP assays were performed on GC-1 cells that have been cultured in the presence of dimethylsulphoxide using either a specific antibody (recognizing either KDM1 (black bars) or HDAC1 (grey bars)) or the corresponding IgG controls (white bars), (rabbit IgG  =  RIgG; mouse IgG  =  MIgG). Each bar represents the ChIP-qPCR results of two independent, pooled experiments. Signals of target DNA received from IgG controls served as base and were defined as one. Fold change represents the 2∧-(ΔΔCT) value, where the normalized IgG signal is subtracted from the normalized signal of the specific antibody. QPCR results were analyzed on an agarose gel and shown underneath the corresponding graph.
Figure 9
Figure 9. Epigenetic remodeling in Pouf5f1 and Gfra1 promoter regions - a proposed model to explain changes in gene expression in GC-1 cells after Tranylcypromine and TSA treatment.
(A) In untreated GC-1 cells (regular growth conditions), repressive epigenetic marks (e.g. H3K9 methylation and CpG methylation) keep the Pou5f1 promoter silent, by creating a tight chromatin structure and preventing the binding of the transcription machinery. Multi-protein complexes that contain writers of repressive epigenetic marks, e.g. HDACs and/or HDAC/KDM1, create a repressive chromatin state. Blocking these enzymes using TSA (targets HDACs) and/or tranylcypromine (represses KDM1) results in the accumulation of activating epigenetic marks (H3K4 methylation, H3 acetylation), thereby making it accessible for transcription factors and the transcription machinery, which eventually results in the induction of Pou5f1 expression. (B) Repressive and activating epigenetic marks at the promoter are responsible for the weak expression of Gfra1 in untreated GC-1 cells. The exposure of GC-1 cells to tranylcypromine and TSA blocks the gene silencing activities of HDACs and/or HDAC/KDM1 and allows for the accumulation of activating epigenetic marks. Thus the treatment shifts the epigenetic landscape at the Gfra1 promoter to a more active state and eventually triggers a stronger transcription of Gfra1. Histone deacetylase (HDAC), lysine-specific demethylase 1 (KDM1), tranylcypromine (T), trichostatin A (TSA).

Similar articles

Cited by

References

    1. Kimmins S, Sassone-Corsi P. Chromatin remodelling and epigenetic features of germ cells. Nature. 2005;434:583–589. - PubMed
    1. Chen C, Ouyang W, Grigura V, Zhou Q, Carnes K, et al. ERM is required for transcriptional control of the spermatogonial stem cell niche. Nature. 2005;436:1030–1034. - PMC - PubMed
    1. Costoya JA, Hobbs RM, Barna M, Cattoretti G, Manova K, et al. Essential role of Plzf in maintenance of spermatogonial stem cells. Nat Genet. 2004;36:653–659. - PubMed
    1. He Z, Jiang J, Hofmann MC, Dym M. Gfra1 silencing in mouse spermatogonial stem cells results in their differentiation via the inactivation of RET tyrosine kinase. Biol Reprod. 2007;77:723–733. - PMC - PubMed
    1. Oatley JM, Avarbock MR, Telaranta AI, Fearon DT, Brinster RL. Identifying genes important for spermatogonial stem cell self-renewal and survival. Proc Natl Acad Sci U S A. 2006;103:9524–9529. - PMC - PubMed

Publication types

MeSH terms

Substances