

Thymic alterations in GM2 gangliosidoses model mice
- PMID: 20856892
- PMCID: PMC2938369
- DOI: 10.1371/journal.pone.0012105
Thymic alterations in GM2 gangliosidoses model mice
Abstract
Background: Sandhoff disease is a lysosomal storage disorder characterized by the absence of β-hexosaminidase and storage of GM2 ganglioside and related glycolipids. We have previously found that the progressive neurologic disease induced in Hexb(-/-) mice, an animal model for Sandhoff disease, is associated with the production of pathogenic anti-glycolipid autoantibodies.
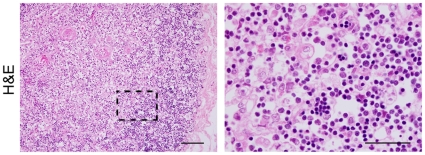
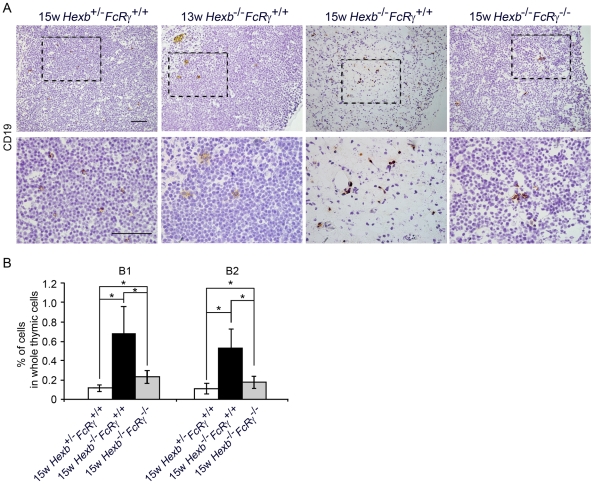
Methodology/principal findings: In our current study, we report on the alterations in the thymus during the development of mild to severe progressive neurologic disease. The thymus from Hexb(-/-) mice of greater than 15 weeks of age showed a marked decrease in the percentage of immature CD4(+)/CD8(+) T cells and a significantly increased number of CD4(+)/CD8(-) T cells. During involution, the levels of both apoptotic thymic cells and IgG deposits to T cells were found to have increased, whilst swollen macrophages were prominently observed, particularly in the cortex. We employed cDNA microarray analysis to monitor gene expression during the involution process and found that genes associated with the immune responses were upregulated, particularly those expressed in macrophages. CXCL13 was one of these upregulated genes and is expressed specifically in the thymus. B1 cells were also found to have increased in the thy mus. It is significant that these alterations in the thymus were reduced in FcRγ additionally disrupted Hexb(-/-) mice.
Conclusions/significance: These results suggest that the FcRγ chain may render the usually poorly immunogenic thymus into an organ prone to autoimmune responses, including the chemotaxis of B1 cells toward CXCL13.
Conflict of interest statement
Figures


Similar articles
-
[Molecular pathogenesis and therapeutic approach of GM2 gangliosidosis].Yakugaku Zasshi. 2013;133(2):269-74. doi: 10.1248/yakushi.12-00199. Yakugaku Zasshi. 2013. PMID: 23370522 Review. Japanese.
-
Possible role of autoantibodies in the pathophysiology of GM2 gangliosidoses.J Clin Invest. 2004 Jan;113(2):200-8. doi: 10.1172/JCI19639. J Clin Invest. 2004. PMID: 14722612 Free PMC article.
-
Thymic involution and corticosterone level in Sandhoff disease model mice: new aspects the pathogenesis of GM2 gangliosidosis.J Inherit Metab Dis. 2011 Oct;34(5):1061-8. doi: 10.1007/s10545-011-9316-6. Epub 2011 May 20. J Inherit Metab Dis. 2011. PMID: 21598013
-
Specific induction of macrophage inflammatory protein 1-alpha in glial cells of Sandhoff disease model mice associated with accumulation of N-acetylhexosaminyl glycoconjugates.J Neurochem. 2005 Mar;92(6):1497-507. doi: 10.1111/j.1471-4159.2005.02986.x. J Neurochem. 2005. PMID: 15748167
-
GM2 Gangliosidoses: Clinical Features, Pathophysiological Aspects, and Current Therapies.Int J Mol Sci. 2020 Aug 27;21(17):6213. doi: 10.3390/ijms21176213. Int J Mol Sci. 2020. PMID: 32867370 Free PMC article. Review.
Cited by
-
Abnormal differentiation of Sandhoff disease model mouse-derived multipotent stem cells toward a neural lineage.PLoS One. 2017 Jun 2;12(6):e0178978. doi: 10.1371/journal.pone.0178978. eCollection 2017. PLoS One. 2017. PMID: 28575132 Free PMC article.
-
Therapeutic response in feline sandhoff disease despite immunity to intracranial gene therapy.Mol Ther. 2013 Jul;21(7):1306-15. doi: 10.1038/mt.2013.86. Epub 2013 May 21. Mol Ther. 2013. PMID: 23689599 Free PMC article.
-
Investigating Immune Responses to the scAAV9-HEXM Gene Therapy Treatment in Tay-Sachs Disease and Sandhoff Disease Mouse Models.Int J Mol Sci. 2021 Jun 23;22(13):6751. doi: 10.3390/ijms22136751. Int J Mol Sci. 2021. PMID: 34201771 Free PMC article.
-
Markedly perturbed hematopoiesis in acid ceramidase deficient mice.Haematologica. 2015 May;100(5):e162-5. doi: 10.3324/haematol.2014.108530. Epub 2015 Feb 14. Haematologica. 2015. PMID: 25682603 Free PMC article. No abstract available.
-
Gaucher disease gene GBA functions in immune regulation.Proc Natl Acad Sci U S A. 2012 Jun 19;109(25):10018-23. doi: 10.1073/pnas.1200941109. Epub 2012 Jun 4. Proc Natl Acad Sci U S A. 2012. PMID: 22665763 Free PMC article.
References
-
- Neufeld EF. Lysosomal storage diseases. Annu Rev Biochem. 1991;60:257–280. - PubMed
-
- Gravel RA, Clarke JTR, Kaback MM, Mahuran D, Sandhoff K, et al. The GM2 gangliosidoses. In: Scriver CR, Beaudet AL, Sly WS, editors. The metabolic and molecular basis of inherited disease. 7th ed. New York: McGraw-Hill. New York; 2001. pp. 3827–3876.
-
- Yamanaka S, Johnson ON, Norflus F, Boles DJ, Proia RL. Structure and expression of the mouse β-hexosaminidase genes, Hexa and Hexb. Genomics 1994. 1994;21:588–596. - PubMed
-
- Sango K, Yamanaka S, Hoffmann A, Okuda Y, Grinberg A, et al. Mouse models of Tay-Sachs and Sandhoff diseases differ in neurologic phenotype and ganglioside metabolism. Mice lacking both subunits of lysosomal β-hexosaminidase display gangliosidosis and mucopolysaccharidosis. Nat Genet. 1995;11:170–176. - PubMed
-
- Phaneuf D, Wakamatsu N, Huang J-Q, Borowski A, Peterson AC, et al. Dramatically different phenotypes in mouse models of human Tay-Sachs and Sandhoff diseases. Hum Mol Genet. 1996;5:1–14. - PubMed
Publication types
MeSH terms
Substances
LinkOut - more resources
Full Text Sources
Molecular Biology Databases
Research Materials
Miscellaneous
