

A sub-cellular viscoelastic model for cell population mechanics
- PMID: 20856895
- PMCID: PMC2938372
- DOI: 10.1371/journal.pone.0012097
A sub-cellular viscoelastic model for cell population mechanics
Abstract
Understanding the biomechanical properties and the effect of biomechanical force on epithelial cells is key to understanding how epithelial cells form uniquely shaped structures in two or three-dimensional space. Nevertheless, with the limitations and challenges posed by biological experiments at this scale, it becomes advantageous to use mathematical and 'in silico' (computational) models as an alternate solution. This paper introduces a single-cell-based model representing the cross section of a typical tissue. Each cell in this model is an individual unit containing several sub-cellular elements, such as the elastic plasma membrane, enclosed viscoelastic elements that play the role of cytoskeleton, and the viscoelastic elements of the cell nucleus. The cell membrane is divided into segments where each segment (or point) incorporates the cell's interaction and communication with other cells and its environment. The model is capable of simulating how cells cooperate and contribute to the overall structure and function of a particular tissue; it mimics many aspects of cellular behavior such as cell growth, division, apoptosis and polarization. The model allows for investigation of the biomechanical properties of cells, cell-cell interactions, effect of environment on cellular clusters, and how individual cells work together and contribute to the structure and function of a particular tissue. To evaluate the current approach in modeling different topologies of growing tissues in distinct biochemical conditions of the surrounding media, we model several key cellular phenomena, namely monolayer cell culture, effects of adhesion intensity, growth of epithelial cell through interaction with extra-cellular matrix (ECM), effects of a gap in the ECM, tensegrity and tissue morphogenesis and formation of hollow epithelial acini. The proposed computational model enables one to isolate the effects of biomechanical properties of individual cells and the communication between cells and their microenvironment while simultaneously allowing for the formation of clusters or sheets of cells that act together as one complex tissue.
Conflict of interest statement
Figures
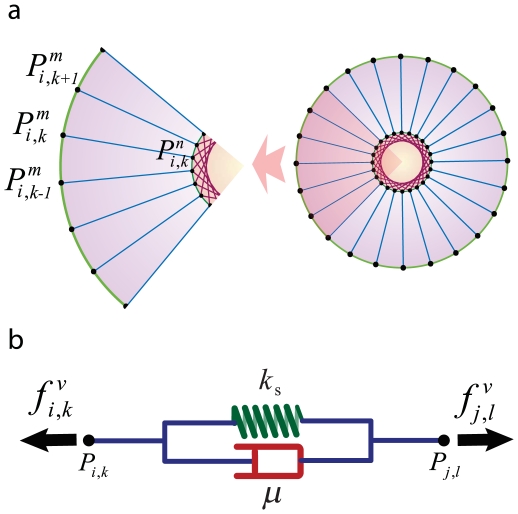
 nodes (points). The superscript
  indicates that the point is on the cell membrane and superscript
  represents a point on the nuclear membrane. If neither
  nor
nor  are specified, the given point can be assumed to lie on either the cell membrane or nucleus. For example, the
  membrane's point of
  cell represented by
  . Each line that connects two points (red, green and blue lines) refers to a Voigt subunit. The total force that acts on each point is
  and is calculated by Eq(1) b) Voigt subunit. A linear Kelvin-Voigt solid element, represented by a purely viscous element (a damper) and purely elastic element (a spring) connected in parallel. The force that is exerted on
  from this subunit is
  (Eq.(2)).
  is the spring constant and
  represents viscosity.
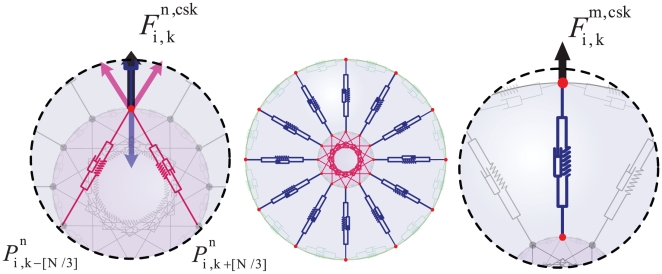
 uniformly radial distributed parts, each of which is replaced by a Voigt subunit radiating from the nucleus (blue subunits). Each subunit connects two points of the cell and nuclear membrane, which are located at a radial direction from the center of the nucleus. The model also contains
  Voigt subunits in the nucleus (red subunits), each of which connect two nuclear membrane points
  and
and  in which
  equal to
  , This allows the nucleus to show more resistance to changes in its shape and volume due to exterior pressure.
  is the cytoskeletal force acting on
  and is calculated by Eq. (3).
  is the force acting on
  from the cytoskeleton and nuclear cytoskeleton and is calculated by Eq. (4).
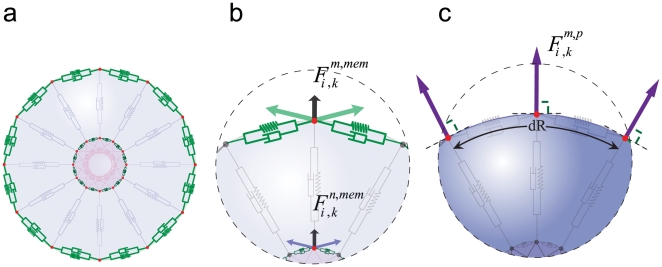
 Voigt subunits on the cell membrane and
  subunits on the nuclear membrane. The forces acting on each cell from membrane subunits is calculated by Eq. (5); as the figures show, each point is subject to two adjacent subunits. c) An osmotic pressure will act on the membrane. This internal pressure is involved in cell morphology and affects the driving force of cell movement –. Knowing the persistence lengths of micotubles, and the fact that they appear curved in the cell, it follows therefore, that this filament pushes the membrane outward . Therefore, a pressure field acting upon each point of the cell membrane, representing cytoplasmic pressure with an outward and perpendicular direction to the cell membrane can be defined as
  by Eq. (6).
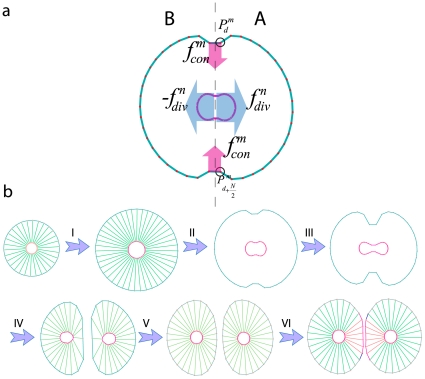
 In mitosis there are two major mechanical forces, first in the Anaphase stage of mitosis, shortening the spindle fibers caused by the kinetochores separation, and the chromatids (daughter chromosomes) are pulled apart and begin moving to the cell poles . Second, a contractile ring is formed by contractile forces acting on the opposite sites of the cell boundary in the cytokinesis process . This results in the formation of a contractile furrow and causes division of the cell into two daughter cells. The cell points can therefore be divided into two groups, A and B, where group A consists of membrane points from
  to
to  and nucleus points from
  to
to  and the remaining points belong to group B. To model the first mechanical force, the points of the nucleus in A and B are pulled apart, in the orthogonal direction to the division axis with force
  (Eq.(8) ). During the nucleus separation, the contractile force,
  , acts on boundary points of A and B groups to model the second mechanical force(Eq. (9)). b) The main phases of cell growth and division. (I) Cell growth. To implement cell growth in the proposed model, the number of membrane points, i.e. the number of viscoelastic compartments, is allowed to increase. When we add two points on each the cell and nuclear membranes, four subunits are added to the system, with the parameters of these new subunits calculated from the average of the first neighbor's homogeneous subunit parameters. With the additional ‘growth’ point, the circumferential length of the membrane increases in proportion to
  . Hence, the rest volume i. e. the volume of the cell when it grows freely without any inner or outer constraint, must increase proportional to
  . Therefore, the rest length of radial springs is increased in proportion to
  . When the area (or volume) of cell doubles, the number of defining membrane points increases to
  , where
  is the number of membrane points on the initial cell. (II,III) Mitotic process: two types of forces act on points to divide the cell. Due to these forces the cell elongates and prepares for division. (IV) Two new daughter nuclei are then placed orthogonal to the axis of cell division. After the nucleus separates, i.e. the distance between the center of the mass of nuclear points exceeds a certain value,
  , the cell will divide into two daughter cells, i.e. the subunits which join the boundary points will be eliminated and will bind to a new first neighbor point in the same group with a new subunit. V) After division takes place, each daughter cell will only have
  points, and as a result it is possible to simultaneously add
  points to each cell. To add membrane points, two consecutive points in the membrane are found that have the longest distance and a new point is inserted between them, and this process is repeated until the number of cell points becomes
  . f) Adhesion of the two daughter cells.
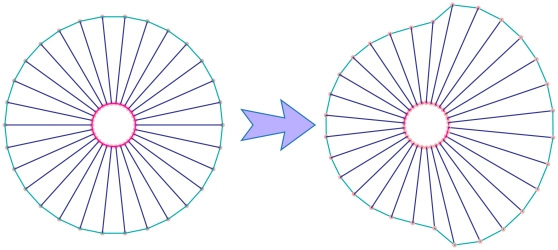
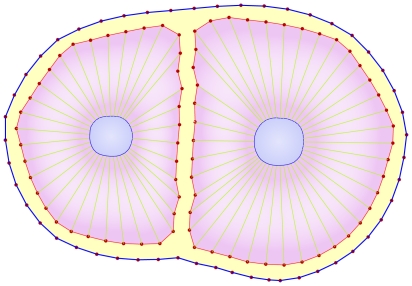
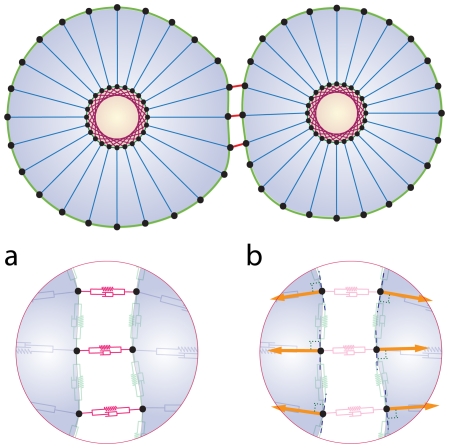
 . The adhesion subunit parameters between two cells are a function of these parameters, for more detail see Eq. (12). b) The repulsive force acts as a short range force. It is a passive force resulting from the elastic interaction with neighboring cells and acts on each point of the cell, when the distance to the other cell points or substrate is less than
  . The magnitude of the repulsive force is a function of the distance of two surfaces (Eq. (13)) and its direction is perpendicular to the membrane, pointing inward to the inner cell.
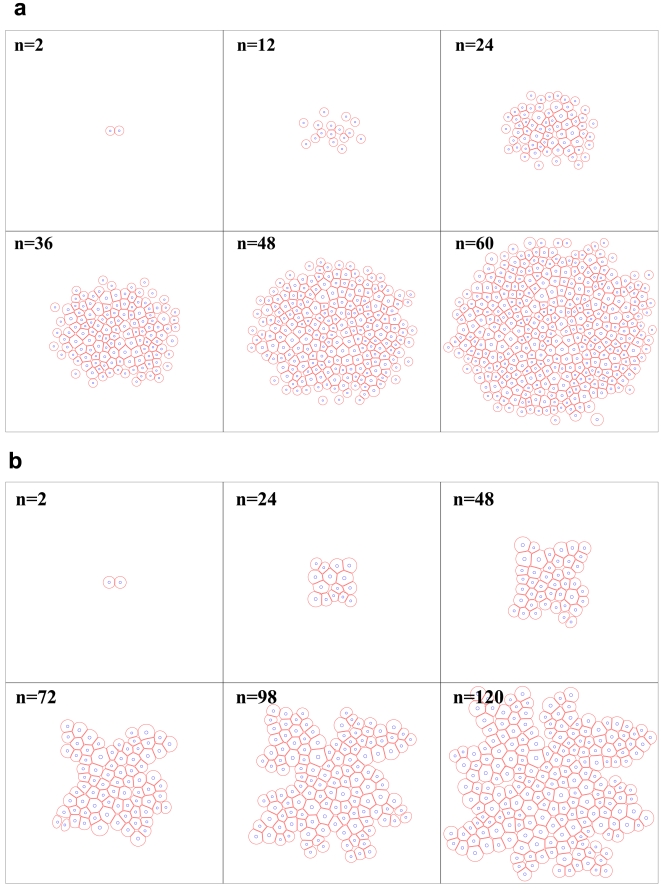
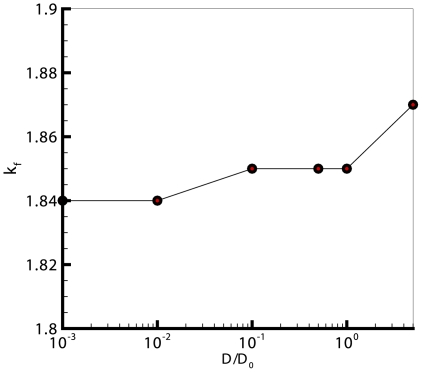
 for cultures with 120 cells, compared against the adhesion intensity. This graph shows a linear relation between
  and the adhesion intensity, which in turn suggests that the cellular shapes are almost circular at low drag coefficients, and diverge from being circular as the drag increases.
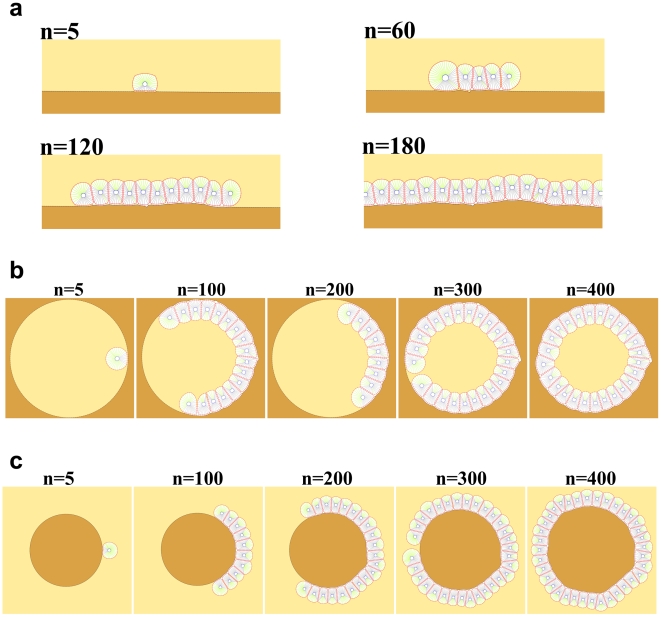
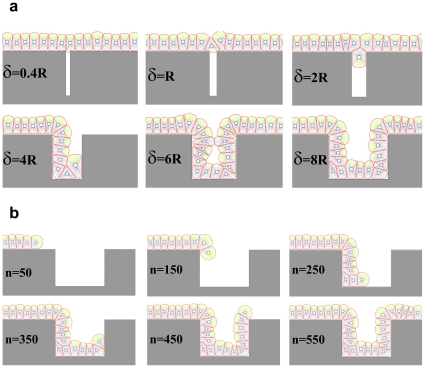
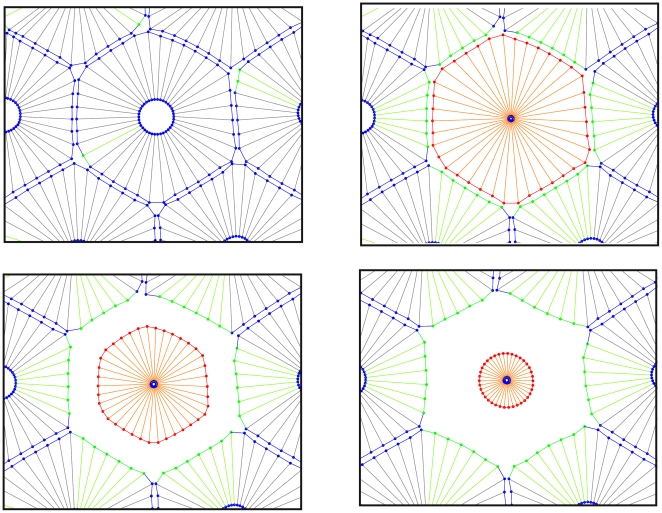
 and the radius of a free epithelial cell with
  , then it can be seen that cells cannot line the gap for
  . For
. For  the first cell which meets the gap will enter it, although due to the pressure of the walls it would not be able to continue its growth and division, so it fills the entry and blocks the gap. Other cells pass over the gap and again create a linear monolayer. For
  cells cannot ignore the gap and penetrate it. They continue their proliferation into the gap; however, when they reach the internal right corner, because of the limitation in space and the forerunning cells being subject to direction changing, the growth is stopped and the cells are entrapped in the gap. For
  the cells can enter the gap without any problem and line it. b) A few snapshots of the growth process when the gap is equal to
  . n represents the dimensionless elapsed time. During simulation, cells show differing behaviors at the corners. The growth rate of cells decreases at the internal corner and increases at the external corner. In addition, at external corners, due to the sudden decrease in contact area, cells detach from the ECM more easily in response to the pressure of neighboring cells. This, in turn, leads to loss of polarity and apoptosis.
References
-
- O'Brien LE, Zegers MMP, E.Mostov K. Building epithelial architecture: insights from three-dimensional culture models. Nature Reviews Molecular Cell Biology. 2002;3:7. - PubMed
-
- Debnath J, Brugge JS. Modelling glandular epithelial cancers in three-dimensional cultures. Nature review cancer. 2005;5:14. - PubMed
-
- Wang AZ. Steps in the morphogenesis of a polarized epithelium. 1990. 15 I. Uncoupling the roles of cell-cell and cell-substratum contact in establishing plasma membrane polarity in multicellular epithelial (MDCK) cysts. - PubMed
-
- Zegers MMP, O'Brien LE, Yu W, Datta A, Mostov KE. Epithelial polarity and tubulogenesis in vitro. Trends in Cell Biology. 2003;13:8. - PubMed
-
- Hogan BLM, Kolodziej PA. Molecular mechanisms of tubulogenesis. Nat Rev Genet. 2002;3:11. - PubMed
Publication types
MeSH terms
LinkOut - more resources
Full Text Sources
Miscellaneous
