. 2010 Sep 13;5(9):e12682.
doi: 10.1371/journal.pone.0012680.

In vivo structure of the E. coli FtsZ-ring revealed by photoactivated localization microscopy (PALM)

Affiliations

In vivo structure of the E. coli FtsZ-ring revealed by photoactivated localization microscopy (PALM)

Guo Fu et al. PLoS One. .

Abstract

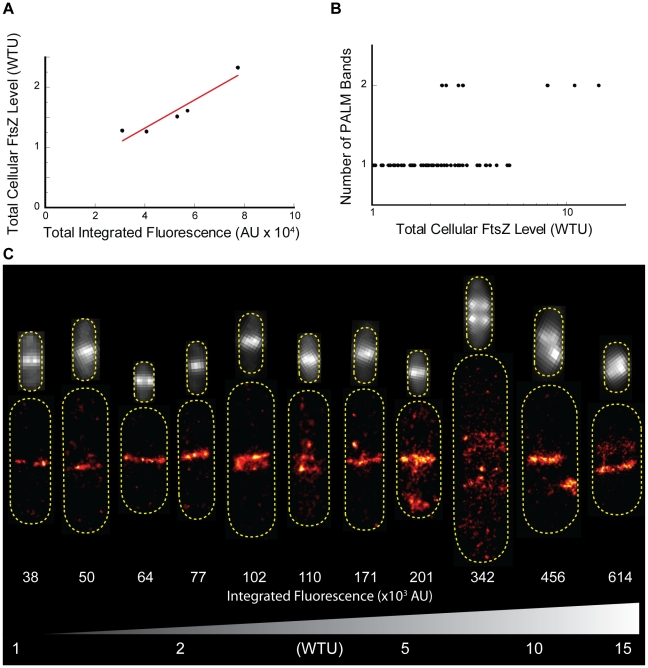
The FtsZ protein, a tubulin-like GTPase, plays a pivotal role in prokaryotic cell division. In vivo it localizes to the midcell and assembles into a ring-like structure-the Z-ring. The Z-ring serves as an essential scaffold to recruit all other division proteins and generates contractile force for cytokinesis, but its supramolecular structure remains unknown. Electron microscopy (EM) has been unsuccessful in detecting the Z-ring due to the dense cytoplasm of bacterial cells, and conventional fluorescence light microscopy (FLM) has only provided images with limited spatial resolution (200-300 nm) due to the diffraction of light. Hence, given the small sizes of bacteria cells, identifying the in vivo structure of the Z-ring presents a substantial challenge. Here, we used photoactivated localization microscopy (PALM), a single molecule-based super-resolution imaging technique, to characterize the in vivo structure of the Z-ring in E. coli. We achieved a spatial resolution of ∼35 nm and discovered that in addition to the expected ring-like conformation, the Z-ring of E. coli adopts a novel compressed helical conformation with variable helical length and pitch. We measured the thickness of the Z-ring to be ∼110 nm and the packing density of FtsZ molecules inside the Z-ring to be greater than what is expected for a single-layered flat ribbon configuration. Our results strongly suggest that the Z-ring is composed of a loose bundle of FtsZ protofilaments that randomly overlap with each other in both longitudinal and radial directions of the cell. Our results provide significant insight into the spatial organization of the Z-ring and open the door for further investigations of structure-function relationships and cell cycle-dependent regulation of the Z-ring.


Conflict of interest statement

Competing Interests: The authors have declared that no competing interests exist.

Figures

Figure 1
Figure 1. Characterization of expression and function of FtsZ and FtsZ-mEos2.
A. Representative immunoblot used to quantify the expression level of FtsZ-mEos2 (top) relative to that of wt FtsZ (bottom) in BL21(DE3)pLysS cells grown under the described condition used for PALM. On average FtsZ-mEos2 is expressed at ∼25% of total intracellular FtsZ concentration. Lanes i and ii illustrate dilutions of the same sample. Duplicate gels were analyzed. B. Histograms of the total integrated green-channel fluorescence of BL21(DE3)pLysS cells expressing FtsZ-mEos2 from pET28 under the induction condition used for PALM. The mean (2.2×10⁴±1.0×10⁴) and distribution (gray) of the entire population are not significantly different from the mean (2.6×10⁴±1.2×10⁴) and distribution (blue) of the population containing Z-rings. C. Live-cell time-lapse image montages of E. coli B/r A cells expressing FtsZ-mEos2 (i) or FtsZ-GFP (ii) are displayed with epi-fluorescence green-channel images atop corresponding bright-field images. Both FtsZ-FPs localize to midcell around the same time (in minutes) after the previous round of cell division. D. Average cell lengths (i) for B/r A cells expressing FtsZ-GFP (N = 438), FtsZ-mEos2 (N = 332) or no fusion proteins (N = 263) and the average cell doubling time (ii) measured from time-lapse imaging of B/r A cells expressing FtsZ-GFP (N = 55), FtsZ-mEos2 (N = 50) or no fusion proteins (N = 27). Bars, 1000 nm.
Figure 2
Figure 2. PALM imaging of the Z-ring in E. coli cells.
A. Schematic representation of photoactivated localization microscopy (PALM) imaging sequence using continuous illumination of the 570-nm excitation laser (yellow line) and the 405-nm activation laser (purple line) simultaneously. The illumination intensity of the 570-nm excitation laser was kept constant throughout the imaging sequence while that of the 405-nm activation laser was increased stepwise as the pool of inactivated FtsZ-mEos2 molecules was depleted over time. B. Fluorescent images of single FtsZ-mEos2 molecules in one E. coli cell excited by the 570-nm laser during one typical PALM imaging sequence. Usually a single FtsZ-mEos2 molecule was detected and photobleached in one single frame (frames 2, 3 and 7). Bar, 500 nm. C. Images of cells expressing FtsZ-mEos2 and mEos2 in the order of bright-field (i), ensemble green fluorescence (ii), regenerated ensemble fluorescence image (iii) and PALM images (iv). The bright-field image of a cell was first taken, and then the ensemble fluorescence image of the cell in the green channel was taken. The PALM imaging sequence was then initiated to record tens of thousand frames similar to what was shown in B. The corresponding PALM image was then constructed from the image stack (Text S1). The regenerated ensemble fluorescence images were constructed by expanding the point-spread-function (PSF) of each single mEos2 molecule in the PALM image to a diffraction-limited spot. These images were indistinguishable from the original epi-fluorescence images, validating the PALM image construction algorithm. The number of molecules used to construct the PALM images were 1083 (C), 1109 (D), 205 (E), 359 (F), and 2277 (G), respectively. Bars, 500 nm.
Figure 3
Figure 3. PALM images of representative fixed E. coli BL21(DE3)pLysS cells expressing FtsZ-mEos2.
Images of fixed cells expressing FtsZ-mEos2 in the order of bright-field (i), ensemble green fluorescence prior to PALM imaging (ii), PALM image (iii), models of helical structures in 3D E. coli cells (iv, Text S2), and simulated PALM images resulting from the helical models shown in iii (v, Text S2). The numbers of FtsZ-mEos2 molecules used to construct the PALM images were 999 (A), 2843 (B), 804 (C), and 627 (D), respectively. Bars, 500 nm.
Figure 4
Figure 4. PALM images of representative live E. coli BL21(DE3)pLysS cells expressing FtsZ-mEos2.
Images of live cells expressing FtsZ-mEos2 in the order of bright-field (i), ensemble green fluorescence prior to PALM imaging (ii), and PALM image (iii), The numbers of FtsZ-mEos2 molecules used to construct the PALM images were 301 (A), 185 (B), 165 (C), 187 (D), 265 (E), 224 (F), 155 (G), 187 (H), 222 (I), and 268 (J), respectively. Bars, 500 nm.
Figure 5
Figure 5. TIR PALM image of an E. coli BL21(DE3)pLysS cell expressing FtsZ-mEos2.
Representative image of a fixed cell expressing FtsZ-mEos2 in the order of bright-field (A), total internal reflection (TIR) ensemble fluorescence image of the cell prior to TIR PALM imaging (B), TIR PALM image (C), and contour plot of FtsZ packing density in units of number of FtsZ-mEos2 molecules per PALM pixel (15×15 nm2). The number of FtsZ-mEos2 molecules used to construct the PALM image was 1704. Bars, 500 nm.
Figure 6
Figure 6. Dependence of Z-ring conformation on FtsZ expression level.
A. Correlation plot showing the linear relationship between the total FtsZ expression level (wt FtsZ + FtsZ-mEos2) of pulse-induced B/r A/pCA24N cells determined by immunoblotting and the corresponding average integrated fluorescence intensity. A linear least squares fit was applied and this conversion was used to estimate the total cellular FtsZ expression level from the integrated ensemble fluorescence (y = 0.4+2.32×10⁻⁵×, R2 = 0.898). B. Plot of Z-ring conformations observed in the PALM images, represented as number of bands, versus total cellular FtsZ level in WTU (log-scale), illustrating that most cells with low-to-intermediate expression levels exhibit single bands, while high expression levels result in exclusively multiple-band conformations. C. Representative PALM plots (bottom) and ensemble fluorescence images (top) are labeled with and arranged according to increasing total integrated fluorescence (AU×103) to illustrate the dependence of Z-ring conformation on FtsZ expression level. A gradient corresponding to the increase in total FtsZ expression level (WTU) is displayed at the bottom. Ensemble fluorescence images are not displayed according to scale and are presented according to the contrast defined by the dynamic range of the individual cell.
Figure 7
Figure 7. Dependence of Z-ring properties on FtsZ expression level.
A. PALM bandwidth (i) and the percent of molecules localized to the Z-ring (ii) are plotted against the total cellular FtsZ expression level in WTU, indicating that higher expression of FtsZ leads to an increased number of FtsZ molecules in the Z-ring, but not to a wider Z-ring. Each plot is conjoined on the right with a corresponding histogram. The width of individual PALM bands was measured in B/r A cells according to the procedure outlined in Figure S3. The percent of molecules localized to the Z-ring was measured in B/r A cells via a custom MatLab (MathWorks) routine that required the Z-ring to be manually outlined by the user. B. Correlation plot showing the linear relationship between the total pixel area of the Z-ring, calculated from the PALM image as the number of pixels containing molecules within the user-defined region, and the total FtsZ expression level. This plot indicates that additional FtsZ molecules preferentially fill in empty spaces in the Z-ring. C. Maximum (gray circles) and average (black squares) Z-ring density are plotted against total FtsZ expression level. Maximum Z-ring density refers to the highest number of detected FtsZ-mEos2 molecules in a single pixel within the user-defined Z-ring boundary. Average Z-ring density is calculated by dividing the total number of FtsZ-mEos2 molecules detected in the Z-ring by the number of pixels they occupied.
Figure 8
Figure 8. Schematic drawings of arrangement of protofilaments inside the Z-ring.
A. Flat-ribbon model. B. Loose bundle model. C. Random model. In each model, the 3D view of the arrangement of FtsZ protofilaments is shown in the middle. The 2D projection of a section of the ring along the long axis of the cell is shown on the left. The cross section of the ring along the short axis of the cell is shown on the right. FtsZ protofilaments are shown as black short arcs and the overall boundary of the Z-ring is outlined in gray. In the flat-ribbon model, FtsZ protofilaments are arranged side-by-side in a single layer. They may or may not be connected head-to-tail to make longer filaments. In the loose bundle model, FtsZ protofilaments loosely associate with each other via non-uniform lateral interactions mediated by the intrinsic affinity between protofilaments and/or bundle-promoting proteins such as ZipA, ZapA and ZapB (not pictured). Individual FtsZ protofilaments are not necessarily aligned with each other and they may have different curvatures. In the random model, FtsZ protofilaments randomly scatter in a narrow band at the midcell and there are large spaces separating individual protofilaments, which do not engage in lateral interactions. Note that the sizes of the cell, the Z-ring and FtsZ protofilaments are not drawn to scale in order to enlarge details in the arrangement of FtsZ protofilaments.

Similar articles

Cited by

References

    1. de Boer P, Crossley R, Rothfield L. The essential bacterial cell-division protein FtsZ is a GTPase. Nature. 1992;359:254–256. - PubMed
    1. Lowe J, Amos LA. Crystal structure of the bacterial cell-division protein FtsZ. Nature. 1998;391:203–206. - PubMed
    1. RayChaudhuri D, Park JT. Escherichia coli cell-division gene ftsZ encodes a novel GTP-binding protein. Nature. 1992;359:251–254. - PubMed
    1. Erickson HP, Taylor DW, Taylor KA, Bramhill D. Bacterial cell division protein FtsZ assembles into protofilament sheets and minirings, structural homologs of tubulin polymers. Proc Natl Acad Sci U S A. 1996;93:519–523. - PMC - PubMed
    1. Popp D, Iwasa M, Narita A, Erickson HP, Maeda Y. FtsZ condensates: An in vitro electron microscopy study. Biopolymers. 2009. - PMC - PubMed

Publication types

MeSH terms