A unified 35-gene signature for both subtype classification and survival prediction in diffuse large B-cell lymphomas
- PMID: 20856936
- PMCID: PMC2938343
- DOI: 10.1371/journal.pone.0012726
A unified 35-gene signature for both subtype classification and survival prediction in diffuse large B-cell lymphomas
Abstract
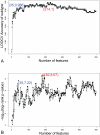
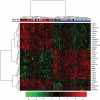
Cancer subtype classification and survival prediction both relate directly to patients' specific treatment plans, making them fundamental medical issues. Although the two factors are interrelated learning problems, most studies tackle each separately. In this paper, expression levels of genes are used for both cancer subtype classification and survival prediction. We considered 350 diffuse large B-cell lymphoma (DLBCL) subjects, taken from four groups of patients (activated B-cell-like subtype dead, activated B-cell-like subtype alive, germinal center B-cell-like subtype dead, and germinal center B-cell-like subtype alive). As classification features, we used 11,271 gene expression levels of each subject. The features were first ranked by mRMR (Maximum Relevance Minimum Redundancy) principle and further selected by IFS (Incremental Feature Selection) procedure. Thirty-five gene signatures were selected after the IFS procedure, and the patients were divided into the above mentioned four groups. These four groups were combined in different ways for subtype prediction and survival prediction, specifically, the activated versus the germinal center and the alive versus the dead. Subtype prediction accuracy of the 35-gene signature was 98.6%. We calculated cumulative survival time of high-risk group and low-risk groups by the Kaplan-Meier method. The log-rank test p-value was 5.98e-08. Our methodology provides a way to study subtype classification and survival prediction simultaneously. Our results suggest that for some diseases, especially cancer, subtype classification may be used to predict survival, and, conversely, survival prediction features may shed light on subtype features.
Conflict of interest statement
Figures


References
-
- A clinical evaluation of the International Lymphoma Study Group classification of non-Hodgkin's lymphoma. The Non-Hodgkin's Lymphoma Classification Project. Blood. 1997;89:3909–3918. - PubMed
-
- Veelken H, Vik Dannheim S, Schulte Moenting J, Martens UM, Finke J, et al. Immunophenotype as prognostic factor for diffuse large B-cell lymphoma in patients undergoing clinical risk-adapted therapy. Ann Oncol. 2007;18:931–939. - PubMed
-
- Berglund M, Thunberg U, Amini RM, Book M, Roos G, et al. Evaluation of immunophenotype in diffuse large B-cell lymphoma and its impact on prognosis. Mod Pathol. 2005;18:1113–1120. - PubMed
-
- Lossos IS, Levy R. Diffuse large B-cell lymphoma: insights gained from gene expression profiling. Int J Hematol. 2003;77:321–329. - PubMed
-
- Turgeon ML. Clinical hematology: theory and procedures. Hagerstown, MD: Lippincott Williams & Wilkins; 2005.
Publication types
MeSH terms
Substances
LinkOut - more resources
Full Text Sources
Other Literature Sources
Research Materials

