. 2010;11(9):R93.
doi: 10.1186/gb-2010-11-9-r93. Epub 2010 Sep 21.

Genome-wide analysis of mRNA decay patterns during early Drosophila development

Affiliations

Genome-wide analysis of mRNA decay patterns during early Drosophila development

Stefan Thomsen et al. Genome Biol. 2010.

Abstract

Background: The modulation of mRNA levels across tissues and time is key for the establishment and operation of the developmental programs that transform the fertilized egg into a fully formed embryo. Although the developmental mechanisms leading to differential mRNA synthesis are heavily investigated, comparatively little attention is given to the processes of mRNA degradation and how these relate to the molecular programs controlling development.

Results: Here we combine timed collection of Drosophila embryos and unfertilized eggs with genome-wide microarray technology to determine the degradation patterns of all mRNAs present during early fruit fly development. Our work studies the kinetics of mRNA decay, the contributions of maternally and zygotically encoded factors to mRNA degradation, and the ways in which mRNA decay profiles relate to gene function, mRNA localization patterns, translation rates and protein turnover. We also detect cis-regulatory sequences enriched in transcripts with common degradation patterns and propose several proteins and microRNAs as developmental regulators of mRNA decay during early fruit fly development. Finally, we experimentally validate the effects of a subset of cis-regulatory sequences and trans-regulators in vivo.

Conclusions: Our work advances the current understanding of the processes controlling mRNA degradation during early Drosophila development, taking us one step closer to the understanding of mRNA decay processes in all animals. Our data also provide a valuable resource for further experimental and computational studies investigating the process of mRNA decay.


Figures
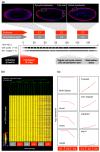
Figure 1
Figure 1
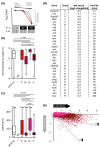
Genome-wide expression profiles in early Drosophila embryos and unfertilized eggs. (a) Microarray time course. Experimental design: sampling intervals, morphological features of embryos, cell cycles (black bars), developmental stages after Hartenstein [111] (grey bars) and hallmarks of early fly development (grey boxes) are indicated. Confocal embryo images: DAPI/FITC-phalloidin stain to highlight cell nuclei (blue) and cell cortices (actin, red). Four replicate samples were analyzed for each treatment. (b) Microarray data quality assessment. Hierarchical clustering (Pearson correlation distance) grouped 24 microarrays (x-axis) into 6 replicate groups (see (a)). Expression levels for approximately 19,000 probe sets (y-axis) are shown in relation to median expression for each probe set across all microarrays. (c) Sample microarray expression profiles. Median log2 expression of four biological replicates; 1 Unit = log2 fold-change 1; error bars represent standard error of the mean over replicates.
Figure 2
Figure 2
Diversity of mRNA decay patterns in Drosophila embryos. (a) Clusters of mRNA decay profiles in early embryos (E1, E2 and E3 (Figure 1a)). We show a selection of profiles with increasing net decay amplitudes (purple bar, filled) and differential contributions of early and late decay (grey and black bars, respectively). (b) Global distribution of net mRNA decay (box plot with median and lower/upper quartile, whiskers from minimum to maximum); we considered all probe sets where E3 is significantly lower than E1 (3,658 probe sets; Figure 1a). (c) Net decay partitioned into early and late decay: major decay events took place late between 2 and 3 h AEL (note high density of points close to x-axis); a subset of transcripts showed early decay between 1 and2 h AEL. Dotted lines indicate the ratio of early and late decay (1:1 or 1:4).
Figure 3
Figure 3
Classification of mRNA expression profiles in early embryos. (a) mRNA pools in embryos are shaped by (i) maternal provision, (ii) transcription, (iii) maternal decay activities and (iv) zygotic decay activities. The sign (+/-) of these contributions to RNA levels and their differential timing is indicated on a time scale for both unfertilized eggs (centre to left, U1 to U3) and embryos (centre to right, E1 to E3). mRNA expression profiles were classified into five major stability classes; clusters of prototypical example profiles are shown for classes I to V. (b) Preloaded, maternal transcriptome: proportions and gene numbers (in square brackets) for classes I to V representing a total of 6,342 genes. (c) Transcriptome of the early embryo: proportion and gene numbers of non-expressed, purely transcribed and maternally provided mRNAs representing a total of 12,814 unique genes. n.c., non-classified and complex patterns.
Figure 4
Figure 4
Kinetics of maternal and zygotic RNA decay activities. (a) Quantification of mRNA decay by measuring global net decay amplitudes and estimating mRNA half-lives. The red line represents the assumed exponential decay between t2 and t3; dotted lines represents the possible non-exponential decay kinetics. (b) Distribution of net decay amplitudes in classes I to V. (c) Distribution of transcript half-lives in classes I to V. Significant differences in medians are indicated by brackets (pairwise comparisons, two-tailed Mann-Whitney test): ***P ≤ 0.001; ****P < 0.0001. All box plots are shown with median and lower/upper quartile, whiskers from minimum to maximum. (d) mRNA decay rates and half-lives for selected genes. (e) Timing of mRNA decay: early versus late decay in classes II to V. Dotted lines indicate the ratio of early and late decay (1:1 or 1:4). Class labels and color codes are as in Figure 3b.
Figure 5
Figure 5
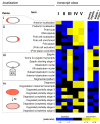
Relating mRNA decay to mRNA localization. Groups of genes sharing common RNA localization terms were recovered from the Fly-FISH database and grouped into four localization themes (i to iv). Enrichment analyses (Fisher's exact test) of co-localized mRNAs within our established transcript classes (Figure 3) were performed to address the correlation of particular RNA localization patterns with RNA stability. A heatmap was constructed to indicate odds ratios (enrichment and depletions). Note that posterior mRNA localization patterns are positively correlated with mRNA decay patterns (classes III to V).
Figure 6
Figure 6
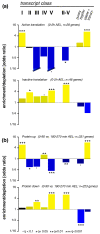
Coordination of RNA and protein turnover. (a) Groups of genes with actively translated or translationally silent mRNAs in early Drosophila embryos were recovered from a genome-wide ribosomal profiling study [68]. Enrichment analyses (Fisher's exact test) were performed to address the correlation between translation rate and RNA stability. Odds ratios (enrichments and depletions) within transcript classes (Figure 3; II-V, union of classes II to V) are shown on a log2 scale (y-axis); color code is as in Figure 5; significance of enrichments are indicated by multiple testing corrected P-values (q-values). (b) A recent proteomics screen identified up- and down-regulated proteins in early fly embryos [69]. Enrichment analyses were performed to address the correlation between protein level changes and RNA stability. Note that RNA decay is negatively correlated with active translation and protein up-regulation.
Figure 7
Figure 7
Cis-regulators of mRNA decay in early Drosophila embryos. (a-c) Motif discovery in 3' UTRs using SYLAMER [70]. Genes were ranked by mRNA net decay values (Figure 2) and enrichment analyses for words of lengths 6 and 8 were performed; -log10 of enrichment P-values (y-axis) are plotted for words enriched in 3' UTRs of unstable mRNAs (x-axis). P-value profiles for the top five enriched motifs are highlighted and shown for each enrichment analysis; a total of 27 unique motifs is shown (asterisk indicates motifs recovered in more than one enrichment). For a peak occurring on the positive y-axis, the corresponding word is overrepresented in the 3' UTRs for the genes to the left of that peak (colored brackets) while the word is underrepresented in the genes to the right. Note that all motifs (1 to 27) are complementary to seed sequences of characterized miRNAs (Supplementary Table 6 in Additional file 1). Enrichment analyses are shown for: (a) all transcripts preloaded onto the oocyte (Figure 3); (b) stable and maternally degraded mRNAs; and (c) stable and zygotically degraded mRNAs (compare Figure 3). (d) mRNAs with AU-rich elements (ARE) were recovered from a genome-wide screen [71]. An enrichment analysis (Fisher's exact test) was performed to address the correlation between AREs and RNA stability. We found that RNA decay (classes II, IV and V) is positively correlated with the presence of AREs in transcript 3' UTRs. Odds ratios (enrichments and depletions) within transcript classes (Figure 3) are shown on a log2 scale (y-axis); color code as in Figure 5; significance of enrichments is indicated by multiple testing corrected P-values (q-values).
Figure 8
Figure 8
The relationship between mRNA decay, mRNA binding proteins and miRNAs. (a-c) Enrichment analyses (Fisher's exact test) were performed for genome-wide mRNA target sets of Pumilio [109], Smaug [43] and miR-309 cluster miRNAs [72] within our transcript classes (Figure 3). Expression dynamics of the regulators during the first 3 h AEL are indicated (see insets; units on x-axis are hours AEL). Odds ratios (enrichments and depletions) are shown on a log2 scale (y-axis); color code as in Figure 5; significance of enrichments is indicated by multiple testing corrected P-values (q-values). (d) miR-309 cluster targets: maternal decay plotted against zygotic decay. Note that most of the mRNA targets show maternal decay contributions. The dotted line represents the 1:1 ratio of maternal and zygotic decay. (e) miRNAs with strong expression restricted to early embryos; odds ratios of miRNA target set enrichment within the mixed decay class (V) and significance levels (q-values) are indicated. Embryonic expression modified after Ruby et al. [75]. (f) mRNA binding proteins (RBP) with dynamic expression (short mRNA half-life, protein log2 fold-change) in early embryos (see text for details). Grey shading highlights RBPs with both low mRNA half-lives and drops in protein levels.
Figure 9
Figure 9
3' UTRs harbor cis-acting elements that dictate specific mRNA fates. (a) Experimental design. Plasmids encoding firefly-luciferase (F-luc) or Renilla-luciferase (R-luc) driven by early zygotic promoters were co-injected into embryos 0 to 1 h AEL (stages 1 to 2). Embryos were aged at 25°C for 4 h and homogenized in lysate buffer. Luciferase activities in lysates were quantified through luminometry. We analyzed 12 to 16 embryos for each reporter construct. (b) mRNA expression of endogenous genes: scute and sisA promoters support expression in early embryos [90] (see (c)); 3' UTRs of stable α-tubulin 84B (α-tub) and unstable cortex mRNAs were tested for their effect on luciferase expression (see (c,d)). Median microarray expression levels for each time point are shown (compare Figure 1). (c) Reporter gene construction. 3' UTRs of stable α-tub and unstable cortex mRNAs were coupled to coding sequences for F-luc; all DNA constructs share a SV40 terminator sequence (SV40 pA). (d) Reporter gene activity. Average median activities (ratio F-luc/R-luc) and standard error of the mean for three independent, biological replicates are shown (12 to 16 embryos analyzed for each replicate). A statistical test (two-tailed Mann-Whitney) for each replicate consistently showed a lack of significant changes in luciferase activity for the α-tub reporter and significantly lower levels for the cortex 3' UTR reporter. N.s., not significant.
Figure 10
Figure 10
Effects of miR-14 on mRNA expression during early Drosophila embryogenesis. (a) Hr78 mRNAs suffered degradation during the first 3 h of development. Microarray time course data (compare Figure 1a). (b) Hr78 mRNAs are predicted to be targeted by five miRNAs, including miR-14 (MicroCosm [112]). (c) Lowering the dose of miR-14 led to significant stabilization of Hr78 mRNAs in early embryos. Semi-quantitative RT-PCR experiments for Hr78 were carried out on RNA samples from wild-type (+/+) and embryos heterozygous (ΔmiR-14/+) or homozygous (ΔmiR-14/ΔmiR-14) for a miR-14 deletion. Lowering the dose of miR-14 led to stabilization of Hr78 mRNAs in a dose-dependent manner. Hr78 signals in agarose gels were normalized to RpL32 (aka Rp49) signals; gels were analyzed using ImageJ software. Error bars, standard error of the mean (SEM).

Similar articles

Cited by

References

    1. Ross J. mRNA stability in mammalian cells. Microbiol Rev. 1995;59:423–450. - PMC - PubMed
    1. Ross J. Control of messenger RNA stability in higher eukaryotes. Trends Genet. 1996;12:171–175. doi: 10.1016/0168-9525(96)10016-0. - DOI - PubMed
    1. Sorenson CM, Hart PA, Ross J. Analysis of herpes simplex virus-induced mRNA destabilizing activity using an in vitro mRNA decay system. Nucleic Acids Res. 1991;19:4459–4465. doi: 10.1093/nar/19.16.4459. - DOI - PMC - PubMed
    1. Thomson AM, Rogers JT, Leedman PJ. Iron-regulatory proteins, iron-responsive elements and ferritin mRNA translation. Int J Biochem Cell Biol. 1999;31:1139–1152. doi: 10.1016/S1357-2725(99)00080-1. - DOI - PubMed
    1. Casey JL, Hentze MW, Koeller DM, Caughman SW, Rouault TA, Klausner RD, Harford JB. Iron-responsive elements: regulatory RNA sequences that control mRNA levels and translation. Science. 1988;240:924–928. doi: 10.1126/science.2452485. - DOI - PubMed

Publication types

MeSH terms

LinkOut - more resources