. 2010 Sep 21:9:253.
doi: 10.1186/1476-4598-9-253.

Trop2 expression contributes to tumor pathogenesis by activating the ERK MAPK pathway

Affiliations

Trop2 expression contributes to tumor pathogenesis by activating the ERK MAPK pathway

Rafael Cubas et al. Mol Cancer. .

Abstract

Background: Trop2 is a cell-surface glycoprotein overexpressed by a variety of epithelial carcinomas with reported low to restricted expression in normal tissues. Expression of Trop2 has been associated with increased tumor aggressiveness, metastasis and decreased patient survival, but the signaling mechanisms mediated by Trop2 are still unknown. Here, we studied the effects murine Trop2 (mTrop2) exerted on tumor cellular functions and some of the signaling mechanisms activated by this oncogene.

Results: mTrop2 expression significantly increased tumor cell proliferation at low serum concentration, migration, foci formation and anchorage-independent growth. These in vitro characteristics translated to increased tumor growth in both subcutaneous and orthotopic pancreatic cancer murine models and also led to increased liver metastasis. mTrop2 expression also increased the levels of phosphorylated ERK1/2 mediating cell cycle progression by increasing the levels of cyclin D1 and cyclin E as well as downregulating p27. The activation of ERK was also observed in human pancreatic ductal epithelial cells and colorectal adenocarcinoma cells overexpressing human Trop2.

Conclusions: These findings demonstrate some of the pathogenic effects mediated by mTrop2 expression on cancer cells and the importance of targeting this cell surface glycoprotein. This study also provides the first indication of a molecular signaling pathway activated by Trop2 which has important implications for cancer cell growth and survival.


Figures

Figure 1
Figure 1
Expression of mTrop2 can promote cell proliferation and cell cycle progression. (a) Stable murine pancreatic adenocarcinoma cells (Panc02) expressing either mTrop2 (Panc02-mTrop2) or GFP (Panc02-GFP) were generated. The increase in mTrop2 mRNA levels in Panc02-mTrop2 cells was measured by quantitative real-time RT PCR. The y axis represents the normalized mTrop2 expression relative to β-actin expression. The protein levels of mTrop2 were determined by Western blot analysis and its membrane incorporation by flow cytometry. (b) Panc02-mTrop2 and control cells were seeded in 96-well plates (1 × 10³ cells/well) and serum-starved for 24 h before changing to growth medium containing 0.2% FBS. MTS assay was performed after breaking serum starvation. Relative increase in viability was measured by dividing the viability at one time point by the viability of the same cell at day 0. Absorbance means ± SD (n = 5) are shown. *P < 0.01. (c) Cell cycle analysis. After 24 h of serum starvation, cells were released by the addition of 2% FBS for 4 h (Panc02 and 4T1 cells) or 8 h (MC38 cells). Cells were collected, fixed, stained with propidium iodide and analyzed for cell cycle phase distribution. Data shown is representative from three independent experimental repeats.
Figure 2
Figure 2
Expression of mTrop2 leads to increased migration, foci formation and anchorage-independent growth. (a) Panc02-mTrop2 and control cells were serum starved for 24 h followed by the addition of media containing either 0% or 5% FBS. Wounds were generated in confluent cell monolayers utilizing a sterile pipette tip. Pictures were taken 24 h after the wound insult. A representative field for each cell line is shown. (b) The expression of mTrop2 led to a loss of contact inhibition and foci formation. Foci greater than 1 mm were counted after 16 days. Mean ± SD is shown (n = 3). ** P < 0.0001. (c) Expression of mTrop2 on the more indolent murine pancreatic adenocarcinoma cell line, Panc03, also led to increased foci formation (arrows). (d) Panc02-mTrop2 cells acquire an enhanced ability to grow in soft agar. Panc02-mTrop2 and control cells were plated in 6-well plates as described in the Methods section. Colonies were measured after 72 h to determine the increased rate of colony formation in Panc02-mTrop2 cells. Results are shown as mean ± SD (n = 3). *P < 0.001.
Figure 3
Figure 3
mTrop2 expression increases tumorigenesis in subcutaneous and orthotopic tumor models. (a) Nu/nu mice were inoculated subcutaneously with 2 × 10⁵ Panc02-GFP or Panc02-mTrop2 cells. Tumor size was monitored for 22 days with digital calipers and volumes reported as mean ± SE (n = 5). *P < 0.01. (b) For the orthotopic model, nude mice were inoculated with 5 × 10⁴ Panc02, Panc02-GFP or Panc02-mTrop2 cells in the pancreas. Mice were monitored daily and euthanized after 14 days; data are reported as mean ± SD (n = 6). *P < 0.01. (c) Expression of mTrop2 led to an increase in tumor size and cell proliferation. Immunohistochemistry of paraffin embedded tumor tissues show expression of mTrop2 and Ki-67. (d) Panc02-mTrop2 cell inoculation results in liver metastasis as depicted in the square and blow out picture. (e) H&E staining shows normal liver cell structure in Panc02 and Panc02-GFP inoculated mice and liver metastasis with aberrant liver cell structure in Panc02-mTrop2 inoculated mice (10× low magnification and 40× high magnification) (f) Immunohistochemistry for Ki-67, PCNA and mTrop2 in livers from Panc02 (A-C), Panc02-GFP (D-F) and Panc02-mTrop2 (G-I at 10× and J-L at 20× magnification) inoculated mice. All images shown are representative of group.
Figure 4
Figure 4
Trop2 is highly conserved among species and mTrop2 expression can stimulate the AP-1 transcription factor. (a) The percentage of sequence identity between the human and murine cytoplasmic tail of Trop2 is 84%. A similar conservation level is observed among other species. "+" indicates a.a. difference. (b) Expression of mTrop2 leads to activation of the AP-1 transcription factor. 293T cells were transiently co-transfected with an AP-1 SEAP reporter construct together with a vector control (pWPXLd) or mTrop2 expressing vector (pWPXLd-mTrop2). As a positive control a pSH-1 SEAP construct was used. Media was collected and processed for SEAP assays and a representative result from three separate experiments done in triplicate is shown as mean ± SD. The negative control was assigned a value of 1, and the other data was normalized to this value. At the time of media collection co-transfected 293T cells show a high level of mTrop2 expression as shown by flow cytometry. (c) Cell lysate from transfected 293T cells used in the AP-1 SEAP assay was harvested and used for immunoblotting to detect the levels of total and phosphorylated ERK1/2. (d) 293T cells were transiently co-transfected with an AP-1 SEAP reporter construct together with pWPXLd or pWPXLd-mTrop2. Cells were subsequently treated with media containing different concentrations of the MEK1 inhibitor PD98059 or DMSO. Media was collected and processed for SEAP assays. Results are shown as mean ± SD.
Figure 5
Figure 5
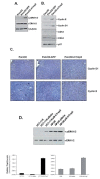
mTrop2 expression stimulates the ERK MAPK pathway. (a) Subconfluent cells were used to prepare cell lysates and 60 μg of protein were used for immunoblotting using antibodies against phosphorylated and total ERK. (b) ERK downstream targets like cyclin E, cyclin D1 and CDK2 show increased expression in mTrop2 expressing cells while p27 is downregulated. (c) Increased expression of cyclin D1 and cyclin E was also observed in tumor tissues from mice inoculated with Panc02-mTrop2 cells, when compared to control Panc02 or Panc02-GFP tumor tissues. Images shown are representative of group. (d) Cell lysates from stable human colorectal cancer (HCT-116) and human pancreatic ductal epithelial (HPDE) cells overexpressing human Trop2 were also used for the detection of activated ERK. Increase in hTrop2 mRNA level in HCT-116 and HPDE cells was measured by quantitative real-time RT PCR. The y axis represents the normalized hTrop2 expression relative to β-actin expression.

References

    1. Cubas R, Li M, Chen C, Yao Q. Trop2: A possible therapeutic target for late stage epithelial carcinomas. Biochim Biophys Acta. 2009;1796(2):309–14. Epub 2009 Aug 14. - PubMed
    1. Fong D, Moser P, Krammel C, Gostner JM, Margreiter R, Mitterer M, Gastl G, Spizzo G. High expression of TROP2 correlates with poor prognosis in pancreatic cancer. Br J Cancer. 2008;99:1290–5. doi: 10.1038/sj.bjc.6604677. - DOI - PMC - PubMed
    1. Fong D, Spizzo G, Gostner JM, Gastl G, Moser P, Krammel C, Gerhard S, Rasse M, Laimer K. TROP2: a novel prognostic marker in squamous cell carcinoma of the oral cavity. Mod Pathol. 2008;21:186–91. - PubMed
    1. Muhlmann G, Spizzo G, Gostner J, Zitt M, Maier H, Moser P, Gastl G, Muller HM, Margreiter R, Ofner D. et al.TROP2 expression as prognostic marker for gastric carcinoma. J Clin Pathol. 2009;62:152–8. doi: 10.1136/jcp.2008.060590. - DOI - PubMed
    1. Nakashima K, Shimada H, Ochiai T, Kuboshima M, Kuroiwa N, Okazumi S, Matsubara H, Nomura F, Takiguchi M, Hiwasa T. Serological identification of TROP2 by recombinant cDNA expression cloning using sera of patients with esophageal squamous cell carcinoma. Int J Cancer. 2004;112:1029–35. doi: 10.1002/ijc.20517. - DOI - PubMed

Publication types

MeSH terms