

Electrostatic origin of salt-induced nucleosome array compaction
- PMID: 20858435
- PMCID: PMC2941033
- DOI: 10.1016/j.bpj.2010.07.017
Electrostatic origin of salt-induced nucleosome array compaction
Abstract
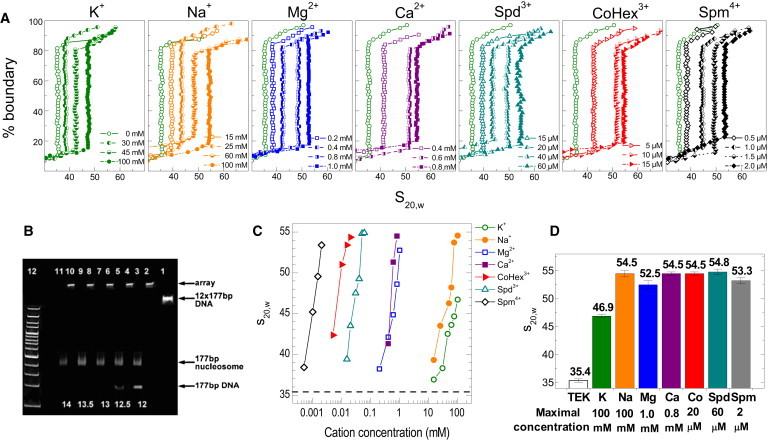
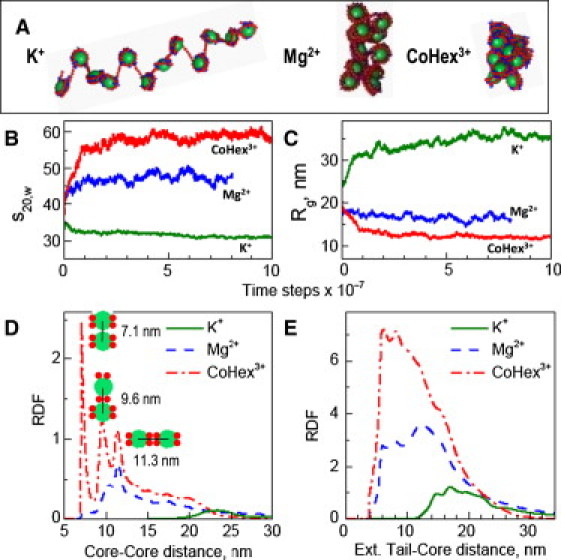
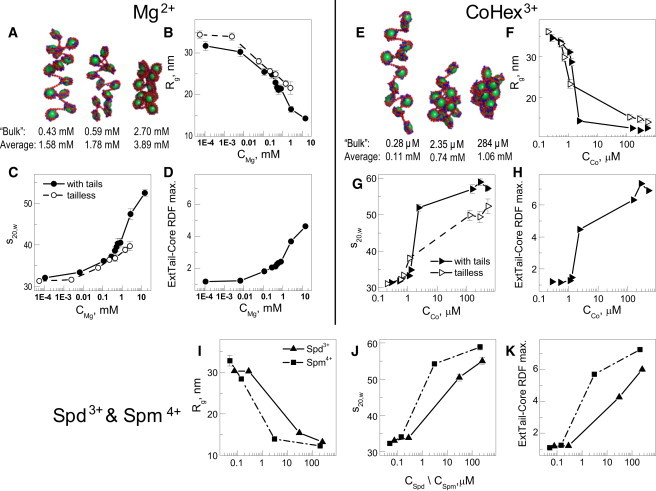
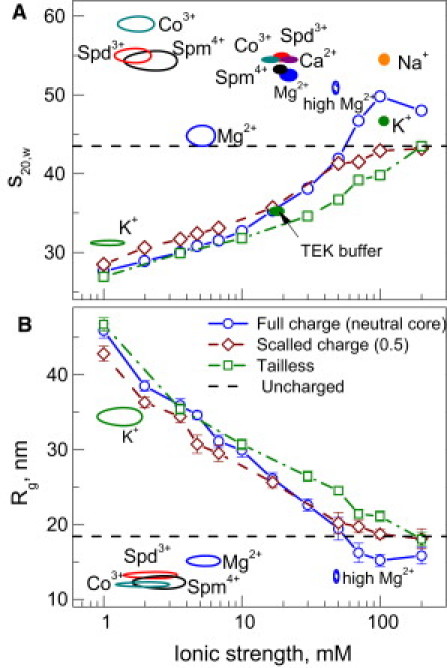
The physical mechanism of the folding and unfolding of chromatin is fundamentally related to transcription but is incompletely characterized and not fully understood. We experimentally and theoretically studied chromatin compaction by investigating the salt-mediated folding of an array made of 12 positioning nucleosomes with 177 bp repeat length. Sedimentation velocity measurements were performed to monitor the folding provoked by addition of cations Na(+), K(+), Mg(2+), Ca(2+), spermidine(3+), Co(NH(3))(6)(3+), and spermine(4+). We found typical polyelectrolyte behavior, with the critical concentration of cation needed to bring about maximal folding covering a range of almost five orders of magnitude (from 2 μM for spermine(4+) to 100 mM for Na(+)). A coarse-grained model of the nucleosome array based on a continuum dielectric description and including the explicit presence of mobile ions and charged flexible histone tails was used in computer simulations to investigate the cation-mediated compaction. The results of the simulations with explicit ions are in general agreement with the experimental data, whereas simple Debye-Hückel models are intrinsically incapable of describing chromatin array folding by multivalent cations. We conclude that the theoretical description of the salt-induced chromatin folding must incorporate explicit mobile ions that include ion correlation and ion competition effects.
Copyright © 2010 Biophysical Society. Published by Elsevier Inc. All rights reserved.
Figures
Similar articles
-
Cation-induced polyelectrolyte-polyelectrolyte attraction in solutions of DNA and nucleosome core particles.Adv Colloid Interface Sci. 2010 Jul 12;158(1-2):32-47. doi: 10.1016/j.cis.2009.08.002. Epub 2009 Aug 26. Adv Colloid Interface Sci. 2010. PMID: 19758583 Review.
-
Chromatin compaction under mixed salt conditions: opposite effects of sodium and potassium ions on nucleosome array folding.Sci Rep. 2015 Feb 17;5:8512. doi: 10.1038/srep08512. Sci Rep. 2015. PMID: 25688036 Free PMC article.
-
CG modeling of nucleosome arrays reveals the salt-dependent chromatin fiber conformational variability.J Chem Phys. 2025 Jan 14;162(2):024101. doi: 10.1063/5.0242509. J Chem Phys. 2025. PMID: 39774881
-
Electrostatic mechanism of nucleosomal array folding revealed by computer simulation.Proc Natl Acad Sci U S A. 2005 Jun 7;102(23):8180-5. doi: 10.1073/pnas.0408867102. Epub 2005 May 26. Proc Natl Acad Sci U S A. 2005. PMID: 15919827 Free PMC article.
-
Breaths, Twists, and Turns of Atomistic Nucleosomes.J Mol Biol. 2021 Mar 19;433(6):166744. doi: 10.1016/j.jmb.2020.166744. Epub 2020 Dec 10. J Mol Biol. 2021. PMID: 33309853 Review.
Cited by
-
Quantitative analysis of single-molecule force spectroscopy on folded chromatin fibers.Nucleic Acids Res. 2015 Apr 20;43(7):3578-90. doi: 10.1093/nar/gkv215. Epub 2015 Mar 16. Nucleic Acids Res. 2015. PMID: 25779043 Free PMC article.
-
Physical modeling of nucleosome clustering in euchromatin resulting from interactions between epigenetic reader proteins.Proc Natl Acad Sci U S A. 2024 Jun 25;121(26):e2317911121. doi: 10.1073/pnas.2317911121. Epub 2024 Jun 20. Proc Natl Acad Sci U S A. 2024. PMID: 38900792 Free PMC article.
-
Protein/DNA interactions in complex DNA topologies: expect the unexpected.Biophys Rev. 2016;8(Suppl 1):145-155. doi: 10.1007/s12551-016-0241-7. Epub 2016 Nov 14. Biophys Rev. 2016. PMID: 28035245 Free PMC article. Review.
-
Elucidating internucleosome interactions and the roles of histone tails.Biophys J. 2013 Jul 2;105(1):194-9. doi: 10.1016/j.bpj.2013.05.021. Biophys J. 2013. PMID: 23823239 Free PMC article.
-
The effects of histone H4 tail acetylations on cation-induced chromatin folding and self-association.Nucleic Acids Res. 2011 Mar;39(5):1680-91. doi: 10.1093/nar/gkq900. Epub 2010 Nov 2. Nucleic Acids Res. 2011. PMID: 21047799 Free PMC article.
References
-
- Luger K., Mäder A.W., Richmond T.J. Crystal structure of the nucleosome core particle at 2.8 A resolution. Nature. 1997;389:251–260. - PubMed
-
- Hansen J.C. Conformational dynamics of the chromatin fiber in solution: determinants, mechanisms, and functions. Annu. Rev. Biophys. Biomol. Struct. 2002;31:361–392. - PubMed
-
- Horn P.J., Peterson C.L. Molecular biology. Chromatin higher order folding—wrapping up transcription. Science. 2002;297:1824–1827. - PubMed
-
- Wolffe A.P. Academic Press; San Diego, CA: 1998. Chromatin: Structure and Function.
Publication types
MeSH terms
Substances
LinkOut - more resources
Full Text Sources
Miscellaneous
