

Neutron reflectometry study of the conformation of HIV Nef bound to lipid membranes
- PMID: 20858440
- PMCID: PMC2941035
- DOI: 10.1016/j.bpj.2010.07.016
Neutron reflectometry study of the conformation of HIV Nef bound to lipid membranes
Abstract
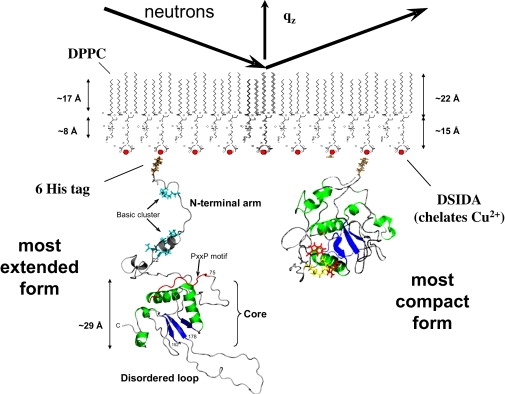
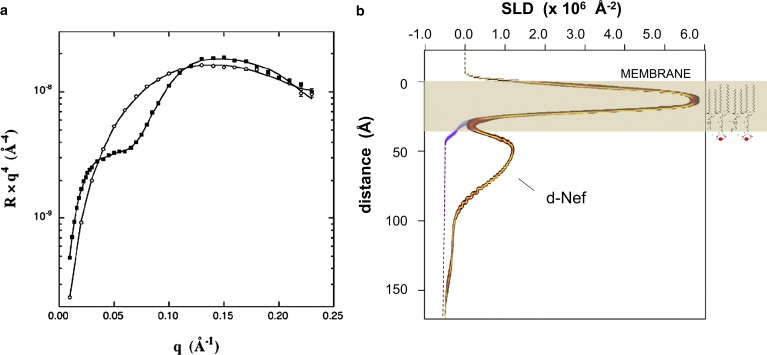
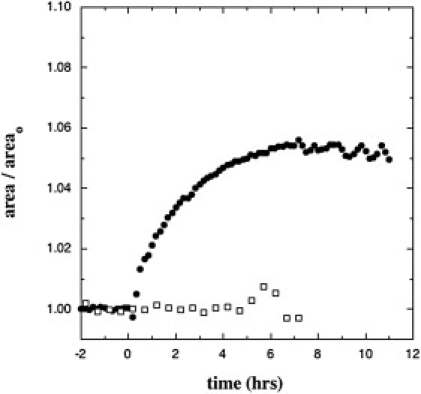
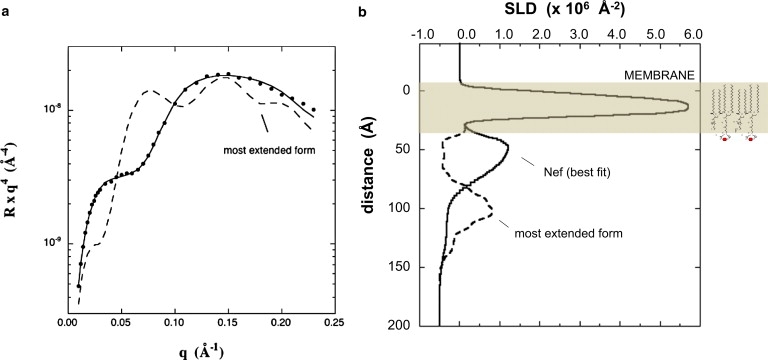
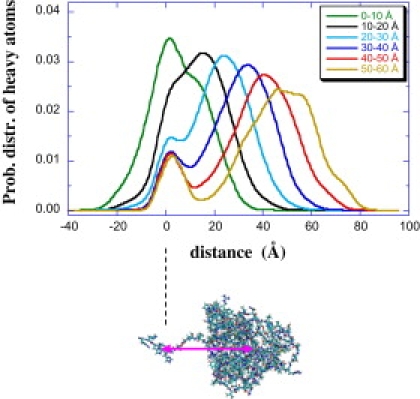
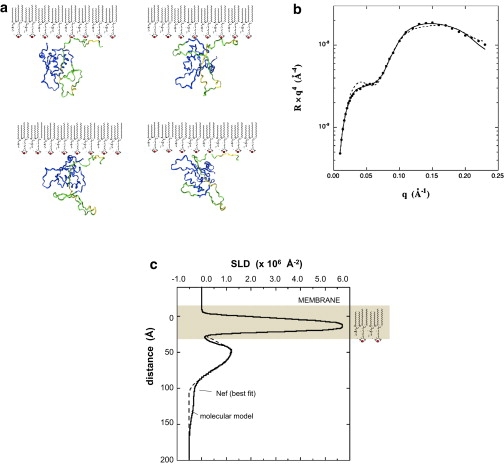
Nef is an HIV-1 accessory protein that directly contributes to AIDS progression. Nef is myristoylated on the N-terminus, associates with membranes, and may undergo a transition from a solution conformation to a membrane-associated conformation. It has been hypothesized that conformational rearrangement enables membrane-associated Nef to interact with cellular proteins. Despite its medical relevance, to our knowledge there is no direct information about the conformation of membrane-bound Nef. In this work, we used neutron reflection to reveal what we believe are the first details of the conformation of membrane-bound Nef. The conformation of Nef was probed upon binding to Langmuir monolayers through the interaction of an N-terminal His tag with a synthetic metal-chelating lipid, which models one of the possible limiting cases for myr-Nef. The data indicate that residues are inserted into the lipid headgroups during interaction, and that the core domain lies directly against the lipid headgroups, with a thickness of ∼40 A. Binding of Nef through the N-terminal His tag apparently facilitates insertion of residues, as no insertion occurred upon binding of Nef through weak electrostatic interactions in the absence of the specific interaction through the His tag.
Copyright © 2010 Biophysical Society. Published by Elsevier Inc. All rights reserved.
Figures
Similar articles
-
Membrane-Associated Conformation of HIV-1 Nef Investigated with Hydrogen Exchange Mass Spectrometry at a Langmuir Monolayer.Anal Chem. 2015 Jul 21;87(14):7030-5. doi: 10.1021/acs.analchem.5b01725. Epub 2015 Jul 2. Anal Chem. 2015. PMID: 26133569 Free PMC article.
-
Conformational transition of membrane-associated terminally acylated HIV-1 Nef.Structure. 2013 Oct 8;21(10):1822-33. doi: 10.1016/j.str.2013.08.008. Epub 2013 Sep 12. Structure. 2013. PMID: 24035710 Free PMC article.
-
Neutron Reflectometry and Molecular Simulations Demonstrate HIV-1 Nef Homodimer Formation on Model Lipid Bilayers.J Mol Biol. 2023 Apr 15;435(8):168009. doi: 10.1016/j.jmb.2023.168009. Epub 2023 Feb 10. J Mol Biol. 2023. PMID: 36773691 Free PMC article.
-
How HIV Nef Proteins Hijack Membrane Traffic To Promote Infection.J Virol. 2019 Nov 26;93(24):e01322-19. doi: 10.1128/JVI.01322-19. Print 2019 Dec 15. J Virol. 2019. PMID: 31578291 Free PMC article. Review.
-
Physiological relevance of ACOT8-Nef interaction in HIV infection.Rev Med Virol. 2019 Sep;29(5):e2057. doi: 10.1002/rmv.2057. Epub 2019 Jun 9. Rev Med Virol. 2019. PMID: 31179598 Review.
Cited by
-
Zooming in on disordered systems: neutron reflection studies of proteins associated with fluid membranes.Biochim Biophys Acta. 2014 Sep;1838(9):2341-9. doi: 10.1016/j.bbamem.2014.03.007. Epub 2014 Mar 25. Biochim Biophys Acta. 2014. PMID: 24674984 Free PMC article. Review.
-
Monitoring shifts in the conformation equilibrium of the membrane protein cytochrome P450 reductase (POR) in nanodiscs.J Biol Chem. 2012 Oct 5;287(41):34596-603. doi: 10.1074/jbc.M112.400085. Epub 2012 Aug 13. J Biol Chem. 2012. PMID: 22891242 Free PMC article.
-
Sensitivity of peripheral membrane proteins to the membrane context: A case study of phosphatidylserine and the TIM proteins.Biochim Biophys Acta Biomembr. 2018 Oct;1860(10):2126-2133. doi: 10.1016/j.bbamem.2018.06.010. Epub 2018 Jun 18. Biochim Biophys Acta Biomembr. 2018. PMID: 29920237 Free PMC article. Review.
-
Antiretroviral Drug Discovery Targeting the HIV-1 Nef Virulence Factor.Viruses. 2022 Sep 13;14(9):2025. doi: 10.3390/v14092025. Viruses. 2022. PMID: 36146831 Free PMC article. Review.
-
Membrane-Associated Conformation of HIV-1 Nef Investigated with Hydrogen Exchange Mass Spectrometry at a Langmuir Monolayer.Anal Chem. 2015 Jul 21;87(14):7030-5. doi: 10.1021/acs.analchem.5b01725. Epub 2015 Jul 2. Anal Chem. 2015. PMID: 26133569 Free PMC article.
References
-
- Bour S., Strebel K. HIV accessory proteins: multifunctional components of a complex system. Adv. Pharmacol. 2000;48:75–120. - PubMed
-
- Frankel A.D., Young J.A. HIV-1: fifteen proteins and an RNA. Annu. Rev. Biochem. 1998;67:1–25. - PubMed
-
- Baur A. Functions of the HIV-1 Nef protein. Curr. Drug Targets Immune Endocr. Metabol. Disord. 2004;4:309–313. - PubMed
Publication types
MeSH terms
Substances
Grants and funding
LinkOut - more resources
Full Text Sources
