. 2010 Sep 22;99(6):1949-58.
doi: 10.1016/j.bpj.2010.07.008.

Mapping conformational ensembles of aβ oligomers in molecular dynamics simulations

Affiliations

Mapping conformational ensembles of aβ oligomers in molecular dynamics simulations

Seongwon Kim et al. Biophys J. .

Abstract

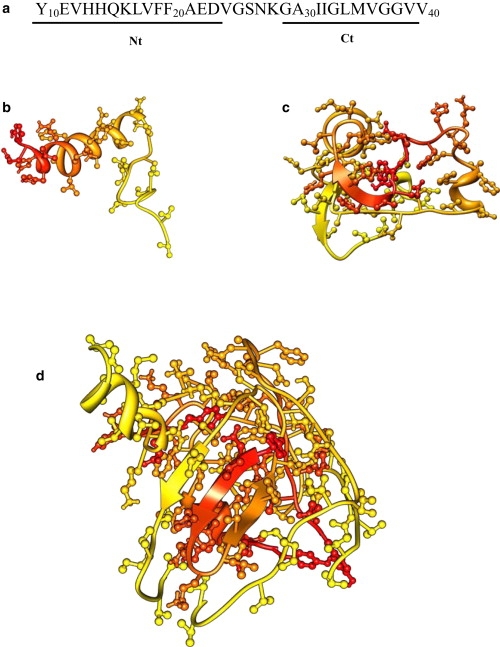
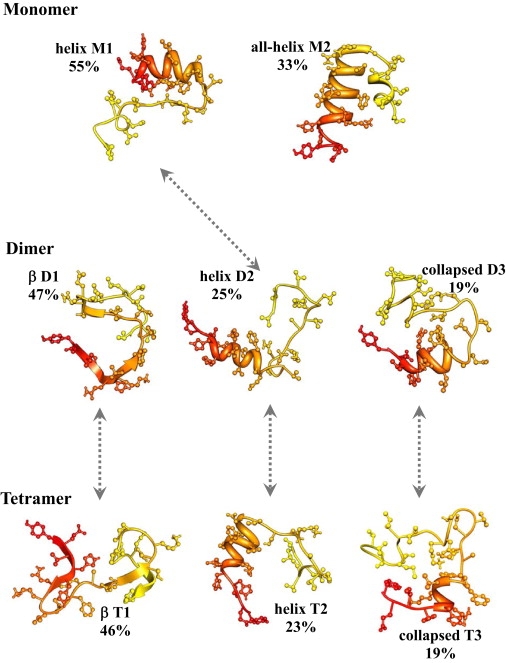
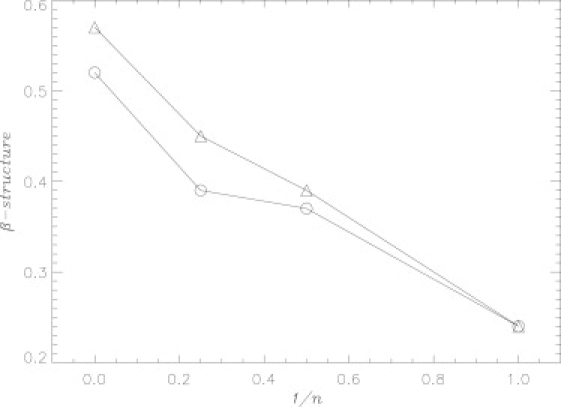
Although the oligomers formed by Aβ peptides appear to be the primary cytotoxic species in Alzheimer's disease, detailed information about their structures appears to be lacking. In this article, we use exhaustive replica exchange molecular dynamics and an implicit solvent united-atom model to study the structural properties of Aβ monomers, dimers, and tetramers. Our analysis suggests that the conformational ensembles of Aβ dimers and tetramers are very similar, but sharply distinct from those sampled by the monomers. The key conformational difference between monomers and oligomers is the formation of β-structure in the oligomers occurring together with the loss of intrapeptide interactions and helix structure. Our simulations indicate that, independent of oligomer order, the Aβ aggregation interface is largely confined to the sequence region 10-23, which forms the bulk of interpeptide interactions. We show that the fractions of β structure computed in our simulations and measured experimentally are in good agreement.


Figures

Figure 1
Figure 1
(a) The sequence of Aβ10–40 peptide and the allocation of the N-terminal Nt and C-terminal Ct regions. (bd) Three Aβ10–40 species studied in our simulations: (b) monomer, (c) dimer, and (d) tetramer. The N- and C-terminals are colored in shades of red and yellow, respectively. The Nt region tends to form most of the interpeptide interactions. The structures are visualized using Chimera (50).
Figure 2
Figure 2
Assembly of Aβ10–40 tetramer is probed by the thermal averages of the numbers of interpeptide side-chain contacts 〈C(T)〉 (solid line) and HBs 〈Nhb(T)〉 (dashed line) as a function of temperature. The plot demonstrates the formation of Aβ10–40 tetramer with the decrease in temperature.
Figure 3
Figure 3
(a) The fractions of helix 〈H(i)〉 and β-strand 〈S(i)〉 structure sampled by residues i in Aβ10–40 tetramer (solid circles), dimer (shaded circles), and monomer (open circles). (b) Distribution of the numbers of residues 〈N(Ls)〉 involved in β-strand fragments of the length Ls. The data for tetramer, dimer, and monomer are shown by open, shaded, and solid bars. (Inset) Distribution of the numbers of residues 〈N(Lh)〉 involved in helix fragments of the length Lh. The data for tetramer and dimer are shown by shaded and open bars. (c) Free energy F(S) of Aβ10–40 peptide as a function of the fraction of residues in the β-strand conformation S: tetramer (solid circles), dimer (shaded circles), and monomer (open circles). The free energy of β structure is ΔF = FβF(S = 0), where Fβ is obtained by integrating over the S states, for which F(S) ≤ Fmin + 1.0RT and Fmin is the minimum in F(S). The free energy F(S) is computed using multiple histogram method (46). This figure suggests that the secondary structure distributions in the tetramers and dimers are similar, but differ sharply from that in the monomer. The plots are computed at 360 K.
Figure 4
Figure 4
Conformational ensembles of Aβ10–40 peptides in monomers, dimers, and tetramers at 360 K. The figure shows typical peptide structures from populated conformational clusters. Shaded arrows indicate similarities between the clusters. The cluster characteristics are given in Tables 2–4. The N- and C-terminals are colored in shades of red and yellow, respectively. The picture demonstrates that the conformational ensembles of monomers and oligomers are distinct, whereas Aβ10–40 peptides in the dimers and tetramers sample similar structural distributions. The structures are visualized using Chimera (50).
Figure 5
Figure 5
The experimental β content Sexp(n) (20) (triangles) and the in silico β content 〈S(n)〉 (open circles) are plotted as a function of the inversed oligomer order n. The plot suggests that simulations reproduce fairly well experimental estimates of secondary structure.

Similar articles

Cited by

References

    1. Selkoe D.J. Folding proteins in fatal ways. Nature. 2003;426:900–904. - PubMed
    1. Hardy J., Selkoe D.J. The amyloid hypothesis of Alzheimer's disease: progress and problems on the road to therapeutics. Science. 2002;297:353–356. - PubMed
    1. Dobson C.M. Protein folding and misfolding. Nature. 2003;426:884–890. - PubMed
    1. Kirkitadze M.D., Bitan G., Teplow D.B. Paradigm shifts in Alzheimer's disease and other neurodegenerative disorders: the emerging role of oligomeric assemblies. J. Neurosci. Res. 2002;69:567–577. - PubMed
    1. Murphy R.M. Peptide aggregation in neurodegenerative disease. Annu. Rev. Biomed. Eng. 2002;4:155–174. - PubMed

Publication types

MeSH terms

Substances

LinkOut - more resources