. 2010 Dec;59(12):3229-39.
doi: 10.2337/db10-0502. Epub 2010 Sep 21.

Common variants at 10 genomic loci influence hemoglobin A₁(C) levels via glycemic and nonglycemic pathways

Nicole Soranzo  1 Serena SannaEleanor WheelerChristian GiegerDörte RadkeJosée DupuisNabila Bouatia-NajiClaudia LangenbergInga ProkopenkoElliot StolermanManjinder S SandhuMatthew M HeeneyJoseph M DevaneyMuredach P ReillySally L RickettsAlexandre F R StewartBenjamin F VoightChristina WillenborgBenjamin WrightDavid AltshulerDan ArkingBeverley BalkauDaniel BarnesEric BoerwinkleBernhard BöhmAmélie BonnefondLori L BonnycastleDorret I BoomsmaStefan R BornsteinYvonne BöttcherSuzannah BumpsteadMary Susan Burnett-MillerHarry CampbellAntonio CaoJohn ChambersRobert ClarkFrancis S CollinsJosef CoreshEco J C de GeusMariano DeiPanos DeloukasAngela DöringJosephine M EganRoberto ElosuaLuigi FerrucciNita ForouhiCaroline S FoxChristopher FranklinMaria Grazia FranzosiSophie GallinaAnuj GoelJürgen GraesslerHarald GrallertAndreas GreinacherDavid HadleyAlistair HallAnders HamstenCaroline HaywardSimon HeathChristian HerderGeorg HomuthJouke-Jan HottengaRachel Hunter-MerrillThomas IlligAnne U JacksonAntti JulaMarcus KleberChristopher W KnouffAugustine KongJaspal KoonerAnna KöttgenPeter KovacsKnut KrohnBrigitte KühnelJohanna KuusistoMarkku LaaksoMark LathropCécile LecoeurMan LiMingyao LiRuth J F LoosJian'an LuanValeriya LyssenkoReedik MägiPatrik K E MagnussonAnders MälarstigMassimo ManginoMaría Teresa Martínez-LarradWinfried MärzWendy L McArdleRuth McPhersonChrista MeisingerThomas MeitingerOlle MelanderKaren L MohlkeVincent E MooserMario A MorkenNarisu NarisuDavid M NathanMatthias NauckChris O'DonnellKonrad OexleNazario OllaJames S PankowFelicity PayneJohn F PedenNancy L PedersenLeena PeltonenMarkus PerolaOzren PolasekEleonora PorcuDaniel J RaderWolfgang RathmannSamuli RipattiGhislain RocheleauMichael RodenIgor RudanVeikko SalomaaRicha SaxenaDavid SchlessingerHeribert SchunkertPeter SchwarzUdo SeedorfElizabeth SelvinManuel Serrano-RíosPeter ShraderAngela SilveiraDavid SiscovickKjioung SongTimothy D SpectorKari StefanssonValgerdur SteinthorsdottirDavid P StrachanRona StrawbridgeMichael StumvollIda SurakkaAmy J SwiftToshiko TanakaAlexander TeumerGudmar ThorleifssonUnnur ThorsteinsdottirAnke TönjesGianluca UsalaVeronique VitartHenry VölzkeHenri WallaschofskiDawn M WaterworthHugh WatkinsH-Erich WichmannSarah H WildGonneke WillemsenGordon H WilliamsJames F WilsonJuliane WinkelmannAlan F WrightWTCCCCarina ZabenaJing Hua ZhaoStephen E EpsteinJeanette ErdmannHakon H HakonarsonSekar KathiresanKay-Tee KhawRobert RobertsNilesh J SamaniMark D FlemingRobert SladekGonçalo AbecasisMichael BoehnkePhilippe FroguelLeif GroopMark I McCarthyW H Linda KaoJose C FlorezManuela UdaNicholas J WarehamInês BarrosoJames B Meigs
Affiliations

Common variants at 10 genomic loci influence hemoglobin A₁(C) levels via glycemic and nonglycemic pathways

Nicole Soranzo et al. Diabetes. 2010 Dec.

Erratum in

  • Diabetes. 2011 Mar;60(3):1050-1. multiple author names added

Abstract

Objective: Glycated hemoglobin (HbA₁(c)), used to monitor and diagnose diabetes, is influenced by average glycemia over a 2- to 3-month period. Genetic factors affecting expression, turnover, and abnormal glycation of hemoglobin could also be associated with increased levels of HbA₁(c). We aimed to identify such genetic factors and investigate the extent to which they influence diabetes classification based on HbA₁(c) levels.

Research design and methods: We studied associations with HbA₁(c) in up to 46,368 nondiabetic adults of European descent from 23 genome-wide association studies (GWAS) and 8 cohorts with de novo genotyped single nucleotide polymorphisms (SNPs). We combined studies using inverse-variance meta-analysis and tested mediation by glycemia using conditional analyses. We estimated the global effect of HbA₁(c) loci using a multilocus risk score, and used net reclassification to estimate genetic effects on diabetes screening.

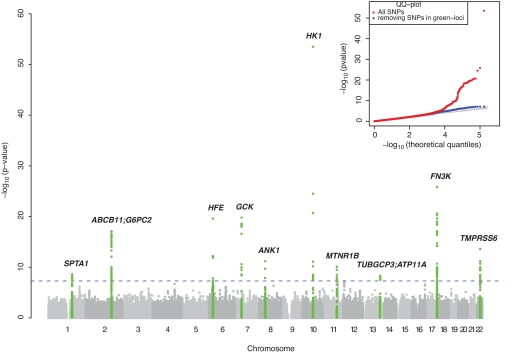
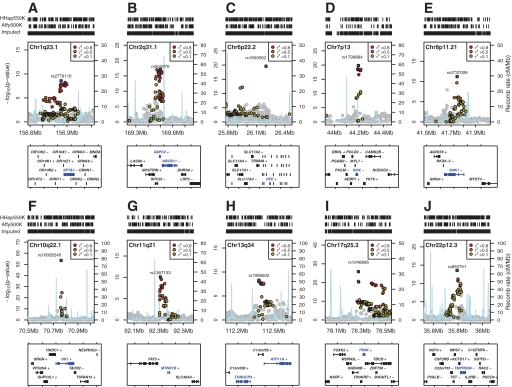
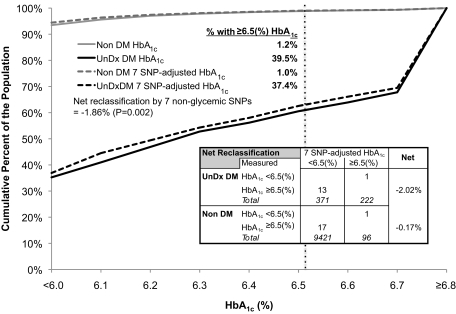
Results: Ten loci reached genome-wide significant association with HbA(1c), including six new loci near FN3K (lead SNP/P value, rs1046896/P = 1.6 × 10⁻²⁶), HFE (rs1800562/P = 2.6 × 10⁻²⁰), TMPRSS6 (rs855791/P = 2.7 × 10⁻¹⁴), ANK1 (rs4737009/P = 6.1 × 10⁻¹²), SPTA1 (rs2779116/P = 2.8 × 10⁻⁹) and ATP11A/TUBGCP3 (rs7998202/P = 5.2 × 10⁻⁹), and four known HbA₁(c) loci: HK1 (rs16926246/P = 3.1 × 10⁻⁵⁴), MTNR1B (rs1387153/P = 4.0 × 10⁻¹¹), GCK (rs1799884/P = 1.5 × 10⁻²⁰) and G6PC2/ABCB11 (rs552976/P = 8.2 × 10⁻¹⁸). We show that associations with HbA₁(c) are partly a function of hyperglycemia associated with 3 of the 10 loci (GCK, G6PC2 and MTNR1B). The seven nonglycemic loci accounted for a 0.19 (% HbA₁(c)) difference between the extreme 10% tails of the risk score, and would reclassify ∼2% of a general white population screened for diabetes with HbA₁(c).

Conclusions: GWAS identified 10 genetic loci reproducibly associated with HbA₁(c). Six are novel and seven map to loci where rarer variants cause hereditary anemias and iron storage disorders. Common variants at these loci likely influence HbA₁(c) levels via erythrocyte biology, and confer a small but detectable reclassification of diabetes diagnosis by HbA₁(c).


Figures

FIG. 1.
FIG. 1.
Manhattan plot and quantile-quantile (QQ) plot of association findings. The figure summarizes the genome-wide association scan results combined across all studies by inverse variance weighting. The blue dotted line marks the threshold for genome-wide significance (5 × 10⁻⁸). SNPs in loci exceeding this threshold are highlighted in green. A QQ plot is shown in the inset panel, where the red line corresponds to all test statistics, and the blue line to results after excluding statistics at all associated loci (highlighted in green in the Manhattan plot). The gray area corresponds to the 90% confidence region from a null distribution of P values (generated from 100 simulations). (A high-quality color representation of this figure is available in the online issue.)
FIG. 2.
FIG. 2.
Regional association plots at the HbA1c loci. Each panel spans ± 250 kb around the most significant associated SNP in the region, which is highlighted with a blue square (panel C spans ± 300 kb). At the top of each panel, comb diagrams indicate the location of SNPs in the Illumina HumanHap 550K and Affymetrix 500K chips, and of SNPs imputed. The SNPs are colored according to their linkage disequilibrium with the top variant based on the CEU HapMap population (http://www.hapmap.org). Gene transcripts are annotated in the lower box, with the most likely biologic candidate highlighted in blue; ± indicates the direction of transcription. In panel C, a few gene names were omitted for clarity. Here, genes are, from left to right, SCGN, HIST1H2AA, HIST1H2BA, SLC17A4, SLC17A1, SLC17A3, SLC17A2, TRIM38, HIST1H1A, HIST1H3A, HIST1H4A, HIST1H4B, HIST1H3B, HIST1H2AB, HIST1H2BB, HIST1H3C, HIST1H1C, HFE, HIST1H4C, HIST1H1T, HIST1H2BC, HIST1H2AC, HIST1H1E, HIST1H2BD, HIST1H2BD, HIST1H2BE, HIST1H4D, HIST1H3D, HIST1H2AD, HIST1H2BF, HIST1H4E, HIST1H2BG, HIST1H2AE, HIST1H3E, HIST1H1D, HIST1H4F, HIST1H4G, HIST1H3F, HIST1H2BH, HIST1H3G, HIST1H2BI, and HIST1H4H. In panel D, the names of the first two genes, UBE2D4 and WBSCR19, were also omitted for clarity. (A high-quality color representation of this figure is available in the online issue.)
FIG. 3.
FIG. 3.
Net reclassification when screening for undiagnosed diabetes, using HbA1c as a population-level measure of genetic effect size. The figure shows the distribution of HbA1c in the FHS and ARIC cohorts combined (N = 10,110), stratified by individuals with undiagnosed type 2 diabetes (UnDx DM, N = 593, black lines) or without diabetes (Non DM, N = 9,517, gray lines), and by HbA1c without adjustment (solid lines) or after adjustment for seven nonglycemic SNPs (dashed lines). The vertical dashed line is the diabetes diagnostic threshold at HbA1c ≥6.5(%). Net reclassification is the overall proportion of the population appropriately moved above or below this line by considering the genetic information. For instance, among individuals with undiagnosed diabetes, 39.5% had an unadjusted HbA1c level ≥6.5 (%) and 37.4% had a seven SNP-adjusted HbA1c level ≥6.5 (%), and among those with undiagnosed diabetes, 2.02% of those with undiagnosed diabetes were misclassified by the influence of the seven SNPs. The net reclassification is calculated as the difference −2.02% − (−0.17%) = −1.86%.

Comment in

References

    1. Mortensen HB, Christophersen C: Glucosylation of human haemoglobin a in red blood cells studied in vitro. Kinetics of the formation and dissociation of haemoglobin HbA1c. Clin Chim Acta 1983; 134: 317– 326 - PubMed
    1. Panzer S, Kronik G, Lechner K, Bettelheim P, Neumann E, Dudczak R: Glycosylated hemoglobins (GHb): an index of red cell survival. Blood 1982; 59: 1348– 1350 - PubMed
    1. Cohen RM, Franco RS, Khera PK, Smith EP, Lindsell CJ, Ciraolo PJ, Palascak MB, Joiner CH: Red cell life span heterogeneity in hematologically normal people is sufficient to alter HbHbA1c. Blood 2008; 112: 4284– 4291 - PMC - PubMed
    1. Roberts WL, Safar-Pour S, De BK, Rohlfing CL, Weykamp CW, Little RR: Effects of hemoglobin C and S traits on glycohemoglobin measurements by eleven methods. Clin Chem 2005; 51: 776– 778 - PubMed
    1. Meigs JB, Panhuysen CI, Myers RH, Wilson PW, Cupples LA: A genome-wide scan for loci linked to plasma levels of glucose and HbA(1C) in a community-based sample of Caucasian pedigrees: the Framingham Offspring Study. Diabetes 2002; 51: 833– 840 - PubMed