. 2010 Oct 1;70(19):7400-10.
doi: 10.1158/0008-5472.CAN-10-0883. Epub 2010 Sep 21.

Hyperpolarized 13C spectroscopic imaging informs on hypoxia-inducible factor-1 and myc activity downstream of platelet-derived growth factor receptor

Affiliations

Hyperpolarized 13C spectroscopic imaging informs on hypoxia-inducible factor-1 and myc activity downstream of platelet-derived growth factor receptor

Hagit Dafni et al. Cancer Res. .

Abstract

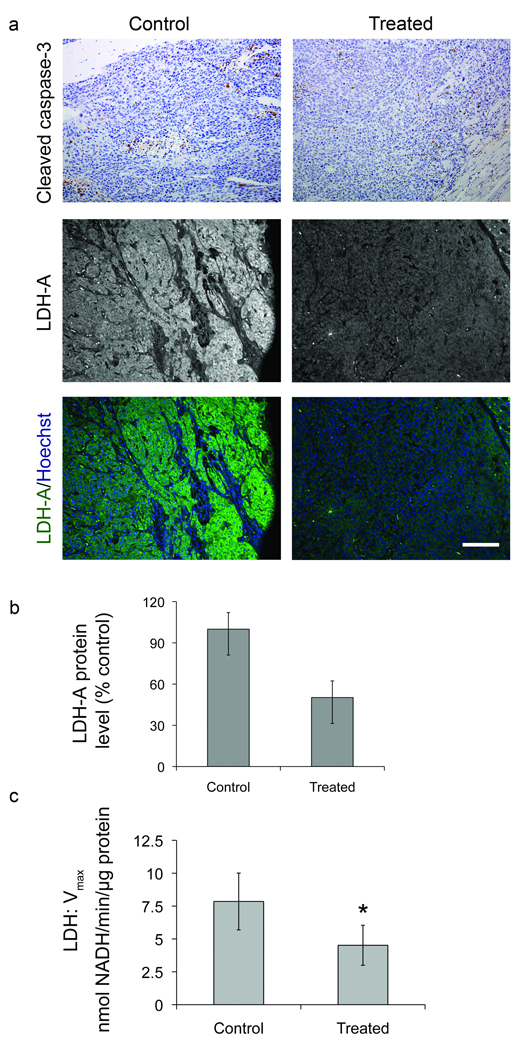
The recent development of hyperpolarized (13)C magnetic resonance spectroscopic imaging provides a novel method for in vivo metabolic imaging with potential applications for detection of cancer and response to treatment. Chemotherapy-induced apoptosis was shown to decrease the flux of hyperpolarized (13)C label from pyruvate to lactate due to depletion of NADH, the coenzyme of lactate dehydrogenase. In contrast, we show here that in PC-3MM2 tumors, inhibition of platelet-derived growth factor receptor with imatinib reduces the conversion of hyperpolarized pyruvate to lactate by lowering the expression of lactate dehydrogenase itself. This was accompanied by reduced expression of vascular endothelial growth factor and glutaminase, and is likely mediated by reduced expression of their transcriptional factors hypoxia-inducible factor-1 and c-Myc. Our results indicate that hyperpolarized (13)C MRSI could potentially detect the molecular effect of various cell signaling inhibitors, thus providing a radiation-free method to predict tumor response.


Conflict of interest statement

Potential conflict of interest: SMR and DBV acknowledge funding from GE Healthcare.

Figures

Fig 1
Fig 1. 13C MRSI of the metabolism of hyperpolarized pyruvate indicating reduced tumor lactate signal in response to treatment
a, Tibia of nude mice were inoculated with PDGFR-expressing PC-3MM2 cells and tumor growth was monitored weekly (w) by axial anatomical T2-weighted images. The tumors (T) first appeared inside the bone marrow of the tibia (B) then lysed and exited the bone continuing to grow in the muscle (M). Scale bar, 5 mm. b, For each animal, hyperpolarized 13C MRSI probing the pyruvate (pyr)-to-lactate (lac) conversion was performed around week 5 (when tumor reached 7–10 mm in diameter), before (d0) and following 2 days (d2) of treatment. Dynamic MRSI started after 12 s of pyruvate injection, lasting for 100s. Lactate signal peak, at ~18 s, was reduced by treatment. c, MRSI spectral arrays corresponding to the maxima in lactate peak at 18 seconds are shown for selected regions of interest and as an overlay of lactate signal intensity over the T2-weighted image slices, running through both tumor-bearing (T) and contralateral (C) limbs. Dynamic lactate curves are plotted for the major tumor voxel indicated in red. Scale bar, 10 mm. Additional pyruvate and lactate dynamic curves are presented in Fig S1 and Fig S2.
Fig 2
Fig 2. Quantitative MRSI results indicating significant decrease in tumor lactate signal due to treatment
Animals were studied before (d0) and following 2 days (d2) of treatment (n=10). a, Lactate signal normalized to noise, percent polarization and injected volume. Averaged values (left) and individual responses (middle; closed circles: imatinib, open circles: imatinib-paclitaxel) in tumor-bearing limbs (*: p=0.021) and averaged values in control (contralateral) limbs (p=0.5) are presented. b, Lactate signal in tumor normalized to control limb (*: p=0.036). c, Lactate signal in tumor normalized to pyruvate signal in blood (tail) (*: p=0.043).
Fig 3
Fig 3. Macromolecular DCE-MRI indicating reduced vascular permeability in response to treatment
a, Tumor-bearing mice were studied by macromolecular DCE-MRI immediately after each MRSI study, before (d0) and following 2 days (d2) of treatment. DCE-MRI is presented as an overlay of maximal intensity projections, of early (1.7 min; blue), intermediate (16.7 min; red) and late (31.7 min; green) time points after injection of macromolecular contrast material (albumin-GdDTPA). In this presentation, non-leaky blood vessels maintain constant enhancement and appear bluish-white, while leak of albumin-GdDTPA from permeable tumor vessels and its accumulation at the tumor periphery during the experimental time course appears yellow-green. Scale bar, 5 mm. b, Vascular permeability was calculated as the change in signal intensity during the first 15 min after injection of contrast material (ΔSI/dt; see Fig S3). Data is presented as a histogram for a representative tumor (upper; same mouse as in a) and the difference between d2 and d0, averaged over all animals (lower), indicating a significant decrease in number of voxels with high permeability and increase in voxels with low permeability (n=10; *: p<0.03). c, Immunohistochemistry staining indicated decrease in VEGF (brown) expression at the tumor periphery due to treatment. Arrows indicate blood vessels.
Fig 4
Fig 4. In-vitro 13C MRS of metabolism of hyperpolarized pyruvate confirming reduced lactate signal in response to treatment
PC-3MM2 cells express PDGFR when cultured in the presence of serum or PDGF. Cultured PC-3MM2 cells were stimulated with PDGF (20 ng/mL) to ensure complete activation of PDGFR signaling and treated with imatinib (50 µM; IM) for one day before encapsulation, and for an additional day prior to 13C MRS study in a perfusion system. a, Dynamic changes in pyruvate and lactate peak areas after injection of hyperpolarized pyruvate. b, Quantitative evaluation indicated significant decrease in maximum lactate signal normalized to cell number and maximum total 13C (n=3; *: p=0.024).
Fig 5
Fig 5. Decrease in expression and activity of LDH-A in response to treatment
Tumors were treated for 2 days, harvested and processed. a, Immunohistochemical staining indicated no change in cleaved caspase-3 (brown; indicator of apoptosis and NAD(H) levels) and decrease in LDH-A expression (the predominant subunit of the enzyme in tumors; green; nuclear counterstain with Hoechst, blue) in response to treatment. Tissue sections show tumor-muscle interface. Scale bar, 200 µm. b, LDH-A protein levels as quantified from immunoblots of tumor lysates (normalized to β-actin (loading control) and presented as percent of control (untreated tumors); Control: n=2; Treated n=4). Immunoblots are shown in Fig S4. c, Vmax of LDH activity (nmol of NADH consumed during 1 min of enzymatic pyruvate-to-lactate conversion by 1 µg of tumor tissue protein) in tumor lysates showed significant decrease due to treatment (n=7) relative to control (n=3; *: p=0.014).
Fig 6
Fig 6. Vascular and metabolic response involves changes in HIF-1 and c-Myc
Tumors were treated for 2 days, harvested and processed. a, Immunohistochemistry staining indicated decrease in carbonic anhydrase IX (CAIX; indicator of HIF-1 activity; brown stain in cell membrane; arrows point at blood vessels) and c-Myc expression (brown staining in nuclei). Note the low staining for CAIX in the immediate vicinity of blood vessels (arrows), reflecting the oxygen level-dependence of HIF-1 activity and the drop in CAIX both at the periphery and at the core of the tumor. Scale bar, 200 µm. b, Immunoblot analysis of tumor lysates for HIF-1α, CAIX, and c-Myc (*: Control: n=3; Treated: n=6; p=0.008) supported data in a. Protein levels were normalized to β-actin (loading control) and presented as percent of control (untreated tumors). Representative immunoblots are presented in Fig S4.

Similar articles

Cited by

References

    1. Warburg O. On the origin of cancer cells. Science. 1956;123:309–314. - PubMed
    1. Vander Heiden MG, Cantley LC, Thompson CB. Understanding the Warburg effect: the metabolic requirements of cell proliferation. Science. 2009;324:1029–1033. - PMC - PubMed
    1. DeBerardinis RJ, Lum JJ, Hatzivassiliou G, Thompson CB. The biology of cancer: metabolic reprogramming fuels cell growth and proliferation. Cell Metab. 2008;7:11–20. - PubMed
    1. Boss DS, Olmos RV, Sinaasappel M, Beijnen JH, Schellens JH. Application of PET/CT in the development of novel anticancer drugs. Oncologist. 2008;13:25–38. - PubMed
    1. Gillies RJ, Robey I, Gatenby RA. Causes and consequences of increased glucose metabolism of cancers. J Nucl Med. 2008;49 Suppl 2 24S–42S. - PubMed

Publication types

MeSH terms