Dynamics of nasal irritation from pulsed homologous alcohols
- PMID: 20858746
- PMCID: PMC2980991
- DOI: 10.1093/chemse/bjq086
Dynamics of nasal irritation from pulsed homologous alcohols
Abstract
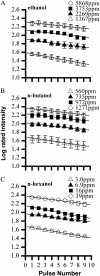
Relatively, few studies have focused on how nasal irritation changes over time. To simulate the rhythm of natural respiration, subjects received 3-s pulses of volatile organic compounds interspersed with 3-s pulses of clean air. Each trial, subjects received 9 pulses of a chemical vapor over about 1 min. Subjects rated nasal irritation from each pulse using magnitude estimation. Within a trial, compound and concentration were fixed. Compound (ethanol, n-butanol, or n-hexanol) and concentration (4 levels for each compound) varied across trials. For all stimuli, rated irritation decreased over time (adaptation). Plots of log-rated intensity versus elapsed time were approximately linear (intensity decreased by a fixed ratio per unit time). Interestingly, the slopes of intensity versus time functions differed very little: Regardless of concentration and compound, rated irritation decreased by about 32% over the 9 pulses. The basic mechanism of short-term adaptation may be the same for the 3 alcohols studied. Regardless, these data suggest that very simple models might be able to describe some aspects of perceptual dynamics quite well.
Figures


Similar articles
-
Temporal integration in nasal lateralization of homologous alcohols.Toxicol Sci. 2007 Sep;99(1):254-9. doi: 10.1093/toxsci/kfm144. Epub 2007 Jun 4. Toxicol Sci. 2007. PMID: 17548891 Free PMC article.
-
Acetone odor and irritation thresholds obtained from acetone-exposed factory workers and from control (occupationally unexposed) subjects.Am Ind Hyg Assoc J. 1997 Oct;58(10):704-12. doi: 10.1080/15428119791012342. Am Ind Hyg Assoc J. 1997. PMID: 9342830
-
Temporal integration in nasal lateralization of homologous propionates.Inhal Toxicol. 2009 Aug;21(10):819-27. doi: 10.1080/08958370802555880. Inhal Toxicol. 2009. PMID: 19555224 Free PMC article.
-
Pain in the trigeminal system: irritation of the nasal mucosa using short- and long-lasting stimuli.Int J Psychophysiol. 2003 Feb;47(2):147-58. doi: 10.1016/s0167-8760(02)00150-2. Int J Psychophysiol. 2003. PMID: 12568945 Review.
-
Evaluating the human response to sensory irritation: implications for setting occupational exposure limits.AIHAJ. 2001 Nov-Dec;62(6):723-9. doi: 10.1080/15298660108984681. AIHAJ. 2001. PMID: 11767938 Review.
References
-
- Abraham MH, Hassanisadi M, Jalali-Heravi M, Ghafourian T, Cain WS, Cometto-Muñiz JE. Draize rabbit eye test compatibility with eye irritation thresholds in humans: a quantitative structure-activity relationship analysis. Toxicol Sci. 2003;76:384–391. - PubMed
-
- Abraham MH, Sánchez-Moreno R, Gil-Lostes J, Cometto-Muñiz JE, Cain WS. Physicochemical modeling of sensory irritation in humans and experimental animals. In: Morris JB, Shusterman DJ, editors. Toxicology of the nose and upper airways. New York: Informa Healthcare USA, Inc; 2010. pp. 376–389.
-
- Anton F, Euchner I, Handwerker HO. Psychophysical examination of pain induced by defined CO2 pulses applied to the nasal mucosa. Pain. 1992;49:53–60. - PubMed
-
- Brand G, Jacquot L. Sensitization and desensitization to allyl isothiocyanate (mustard oil) in the nasal cavity. Chem Senses. 2002;27:593–598. - PubMed
-
- Bryant BP, Silver WL. Chemesthesis: the common chemical sense. In: Finger TE, Silver WL, Restrepo D, editors. The neurobiology of taste and smell. 2nd ed. New York: Wiley-Liss; 2000. pp. 73–100.
Publication types
MeSH terms
Substances
Grants and funding
LinkOut - more resources
Full Text Sources

