. 2011 Apr;12(2):197-210.
doi: 10.1093/biostatistics/kxq055. Epub 2010 Sep 21.

Accurate genome-scale percentage DNA methylation estimates from microarray data

Affiliations

Accurate genome-scale percentage DNA methylation estimates from microarray data

Martin J Aryee et al. Biostatistics. 2011 Apr.

Abstract

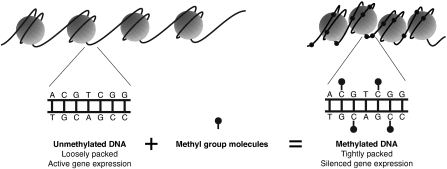
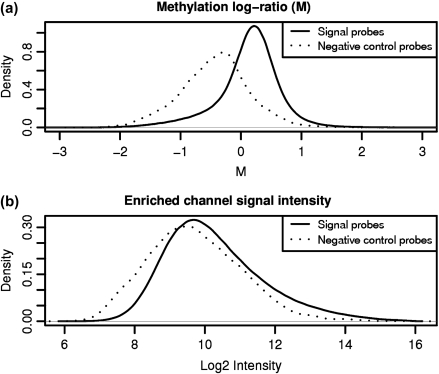
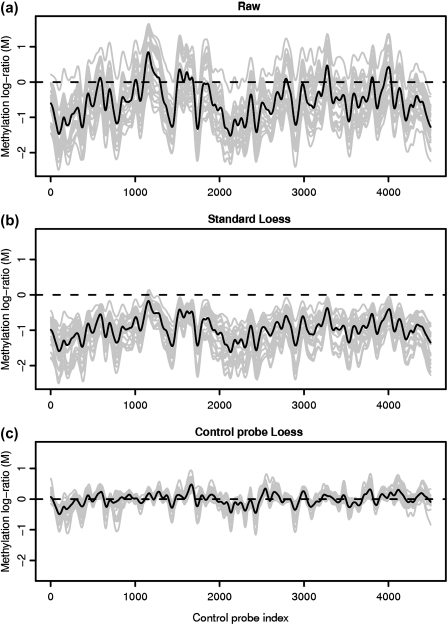
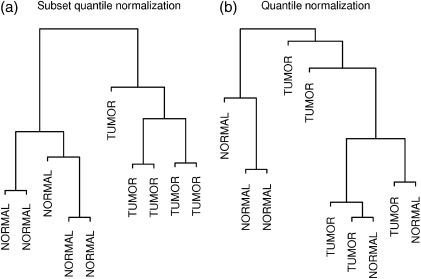
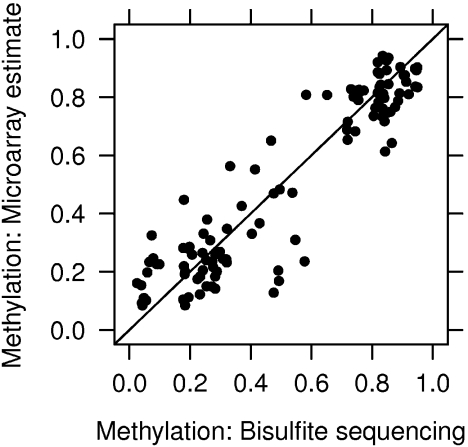
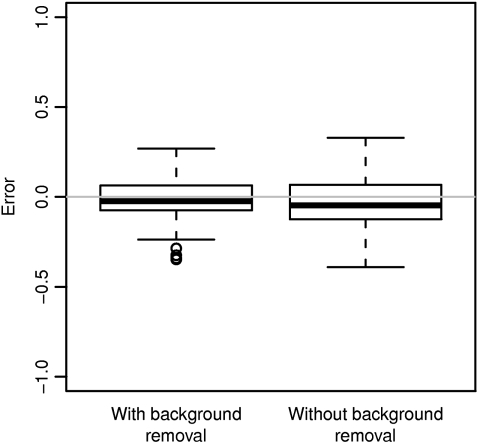
DNA methylation is a key regulator of gene function in a multitude of both normal and abnormal biological processes, but tools to elucidate its roles on a genome-wide scale are still in their infancy. Methylation sensitive restriction enzymes and microarrays provide a potential high-throughput, low-cost platform to allow methylation profiling. However, accurate absolute methylation estimates have been elusive due to systematic errors and unwanted variability. Previous microarray preprocessing procedures, mostly developed for expression arrays, fail to adequately normalize methylation-related data since they rely on key assumptions that are violated in the case of DNA methylation. We develop a normalization strategy tailored to DNA methylation data and an empirical Bayes percentage methylation estimator that together yield accurate absolute methylation estimates that can be compared across samples. We illustrate the method on data generated to detect methylation differences between tissues and between normal and tumor colon samples.


Figures

Fig. 1.
Fig. 1.
DNA (black strand) is wrapped around histone proteins (gray spheres). Unmethylated DNA (left) tends to be loosely packed. Genes in such regions are accessible to the cell's transcriptional machinery and can be expressed. DNA methylation involves the addition of methyl group molecules to cytosine bases. Highly methylated DNA (right) is tightly packed resulting in silenced gene expression.
Fig. 2.
Fig. 2.
While negative control features representing unmethylated regions have lower signals than the signal probes on the M (log ratio) scale (a), they span almost the entire dynamic range of signal in the enriched channel (b) as a result of probe effects.
Fig. 3.
Fig. 3.
Methylation log ratio across 30 unmethylated control regions in a CHARM microarray. The light gray lines show individual sample profiles while the dark lines represent the median signal across samples, clearly showing strong conservation of the “wave” artifact between samples. Neither the raw data (a) nor the standard Loess normalized (b) signals are zero centered as is desirable for unmethylated regions. Control probe Loess normalization (c) achieves both a mean-zero signal for unmethylated regions and an 80% reduction in variation compared to the raw signal.
Fig. 4.
Fig. 4.
Hierarchical clustering dendrogram of 5 normal colon and 5 colon tumor samples following (a) subset quantile normalization and (b) quantile normalization. Subset quantile normalization results in perfect group separation. The top 10 000 most variable probes are used in each case.
Fig. 5.
Fig. 5.
Percentage methylation estimates. The y-axis shows microarray DNA methylation estimates derived from the median of the probes in each validation region. The x-axis shows methylation from an independent gold-standard validation data set obtained by bisulfite treatment and sequencing. The mean difference between microarray and gold-standard estimates is 10%, with highest accuracy at high ( > 70%) and low ( < 30%) methylation levels.
Fig. 6.
Fig. 6.
Error in microarray estimates of percentage methylation with and without background removal. Bisulfite sequencing was used as the gold-standard measurement.

References

    1. Bird A. DNA methylation patterns and epigenetic memory. Genes and Development. 2002;16:6–21. - PubMed
    1. Bolstad BM, Irizarry RA, Astrand M, Speed TP. A comparison of normalization methods for high density oligonucleotide array data based on variance and bias. Bioinformatics. 2003;19:185–193. - PubMed
    1. Clark SJ, Statham A, Stirzaker C, Molloy PL, Frommer M. DNA methylation: bisulphite modification and analysis. Nature Protocols. 2006;1:2353–2364. - PubMed
    1. Cloud J. Why Genes Aren't Destiny. 2010. Time. New York. Volume 175. - PubMed
    1. Down TA, Rakyan VK, Turner DJ, Flicek P, Li H, Kulesha E, Gräf S, Johnson N, Herrero J, Tomazou EM and others. A Bayesian deconvolution strategy for immunoprecipitation-based DNA methylome analysis. Nature Biotechnology. 2008;26:779–785. - PMC - PubMed

Publication types