. 2010 Oct 1;16(19):4843-52.
doi: 10.1158/1078-0432.CCR-10-1206. Epub 2010 Sep 21.

Hypoxia in models of lung cancer: implications for targeted therapeutics

Affiliations

Hypoxia in models of lung cancer: implications for targeted therapeutics

Edward E Graves et al. Clin Cancer Res. .

Abstract

Purpose: To efficiently translate experimental methods from bench to bedside, it is imperative that laboratory models of cancer mimic human disease as closely as possible. In this study, we sought to compare patterns of hypoxia in several standard and emerging mouse models of lung cancer to establish the appropriateness of each for evaluating the role of oxygen in lung cancer progression and therapeutic response.

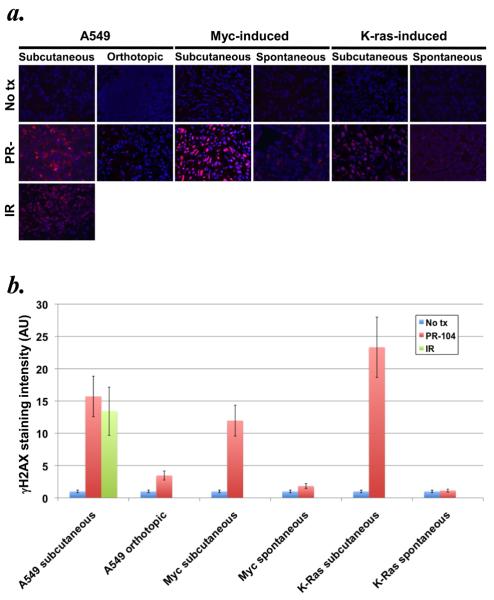
Experimental design: Subcutaneous and orthotopic human A549 lung carcinomas growing in nude mice as well as spontaneous K-ras or Myc-induced lung tumors grown in situ or subcutaneously were studied using fluorodeoxyglucose and fluoroazomycin arabinoside positron emission tomography, and postmortem by immunohistochemical observation of the hypoxia marker pimonidazole. The response of these models to the hypoxia-activated cytotoxin PR-104 was also quantified by the formation of γH2AX foci in vitro and in vivo. Finally, our findings were compared with oxygen electrode measurements of human lung cancers.

Results: Minimal fluoroazomycin arabinoside and pimonidazole accumulation was seen in tumors growing within the lungs, whereas subcutaneous tumors showed substantial trapping of both hypoxia probes. These observations correlated with the response of these tumors to PR-104, and with the reduced incidence of hypoxia in human lung cancers relative to other solid tumor types.

Conclusions: These findings suggest that in situ models of lung cancer in mice may be more reflective of the human disease, and encourage judicious selection of preclinical tumor models for the study of hypoxia imaging and antihypoxic cell therapies.


Figures

Figure 1
Figure 1
In vivo imaging and ex vivo immunohistochemistry of murine models of lung cancer. A. Results obtained from bilateral subcutaneous A549 xenograft tumors (top row), orthotopically implanted A549 xenograft tumors (second row), spontaneous K-ras-induced lung tumors (third row), and spontaneous Myc-induced lung tumors (bottom row) are shown. The data collected from each subject included micro-computed tomography (microCT, left column), fluorodeoxyglucose micro-positron emission tomography (FDG microPET, second column), fluoroazomycin arabinoside microPET (FAZA microPET, third column), and pimonidazole (green) and DAPI (blue) immunohistochemistry (IHC, right column). Displayed intensity ranges for in vivo imaging are given at top. Relevant features are labeled on the CT images, including tumor (T) and heart (H). B and C. Mean FDG and FAZA uptake observed in microPET studies of murine models of lung cancer. The light colored bars are quantified in units of tumor:background ratio (T:B, left vertical axis), while the dark colored bars are in units of percent injected dose per gram of tissue (% ID/g, right vertical axis). Blue: subcutaneous A549 xenograft tumors. Red: orthotopic A549 xenograft tumors. Green: spontaneous K-ras-induced lung tumors. Purple: spontaneous Myc-induced lung tumors. The measurements reported for the subcutaneous tumors indicate the mean and standard deviation over a region-of-interest defined over the tumor, while the measurements for the orthotopic and spontaneous tumors are the mean and standard deviation over a region-of-interest encompassing the lungs and excluding the heart.
Figure 2
Figure 2
Response of lung tumor cell lines to PR-104 treatment in vitro. A. γH2AX (red) and DAPI (blue) immunohistochemistry of human A549, murine Myc-induced lung carcinoma, and murine K-ras-induced lung carcinoma cells treated with 100 μM PR-104 for four hours in 21%, 2%, or 0.5% O2. Untreated cells of each type are shown as a control. B. Quantitated average total γH2AX signal per cell for each treatment group and cell type. Blue: untreated cells. Red: cells treated at 21% O2. Green: cells treated at 2% O2. Purple: cells treated at 0.5% O2. All measurements for a cell type are normalized to the average total γH2AX signal per cell for that cell type treated at 21% O2.
Figure 3
Figure 3
Response of murine lung tumor models to PR-104 treatment in vivo. A. γH2AX (red) and DAPI (blue) immunohistochemistry of subcutaneous and orthotopic A549 tumor xenografts, spontaneous and subcutaneous Myc-induced lung carcinomas, and spontaneous and subcutaneous K-ras-induced lung carcinomas treated with a single intraperitoneal dose of 1.8 mmol/kg PR-104 for 18 hours prior to tissue harvesting. Data collected from subcutaneous A549 tumors treated with 10 Gy of ionizing radiation are shown as a positive control. B. Quantitated average total γH2AX signal per cell for each treatment group and tumor type. Blue: untreated tumors. Red: PR-104 treated tumors. Green: IR-treated tumors. All measurements for a tumor type are normalized to the average total γH2AX signal per cell for that tumor observed without treatment.
Figure 4
Figure 4
In vivo Eppendorf electrode measurements of oxygenation of human lung cancers. A. Box and whisker plot showing the distribution of median tumor pO2 measurements for 21 non small cell lung cancer patients. B. Box and whisker plot showing the distribution of the percentage of oxygen measurements below 2.5 mm Hg (HF2.5) and below 10 mm Hg (HF10) for this patient sample. C. Pie chart demonstrating the proportion of lung cancer patients with HF2.5 above and below a threshold value of 20%. D. Pie chart demonstrating the proportion of lung cancer patients with HF10 above and below a threshold value of 20%.

Comment in

References

    1. Thomlinson RH, Gray LH. The histological structure of some human lung cancers and the possible implications for radiotherapy. British Journal of Cancer. 1955;9:539–49. - PMC - PubMed
    1. Gray LH, Conger AD, Ebert M, Hornsey S, Scott OCA. The concentration of oxygen dissolved in tissues at the time of irradiation as a factor in radiotherapy. British Journal of Radiology. 1953;26:638–48. - PubMed
    1. Höckel M, Vaupel P. Tumor Hypoxia: Definitions and Current Clinical, Biologic, and Molecular Aspects. Journal of the National Cancer Institute. 2001;93:266–76. - PubMed
    1. Young SD, Marshall RS, Hill RP. Hypoxia induces DNA overreplication and enhances metastatic potential of murine tumor cells; Proceedings of the National Academy of Sciences of the United States of America; 1988. pp. 9533–7. - PMC - PubMed
    1. Brizel DM, Scully SP, Harrelson JM, et al. Tumor oxygenation predicts for the likelihood of distant metastases in human soft tissue sarcoma. Cancer Research. 1996;56:941–3. - PubMed

Publication types

MeSH terms