. 2011 Feb;31(2):401-12.
doi: 10.1038/jcbfm.2010.164. Epub 2010 Sep 22.

Negative BOLD-fMRI signals in large cerebral veins

Affiliations

Negative BOLD-fMRI signals in large cerebral veins

Marta Bianciardi et al. J Cereb Blood Flow Metab. 2011 Feb.

Abstract

Reductions in blood oxygenation level dependent (BOLD)-functional magnetic resonance imaging (fMRI) signals below baseline levels have been observed under several conditions as negative activation in task-activation studies or anticorrelation in resting-state experiments. Converging evidence suggests that negative BOLD signals (NBSs) can generally be explained by local reductions in neural activity. Here, we report on NBSs that accompany hemodynamic changes in regions devoid of neural tissue. The NBSs were investigated with high-resolution studies of the visual cortex (VC) at 7 T. Task-activation studies were performed to localize a task-positive area in the VC. During rest, robust negative correlation with the task-positive region was observed in focal regions near the ventricles and dispersed throughout the VC. Both positive and NBSs were dependent on behavioral condition. Comparison with high-resolution structural images showed that negatively correlated regions overlapped with larger pial and ependymal veins near sulcal and ventricular cerebrospinal fluid (CSF). Results from multiecho fMRI showed that NBSs were consistent with increases in local blood volume. These findings confirm theoretical predictions that tie neural activity to blood volume increases, which tend to counteract positive fMRI signal changes associated with increased blood oxygenation. This effect may be more salient in high-resolution studies, in which positive and NBS may be more often spatially distinct.


Figures

Figure 1
Figure 1
(A) Stimulus used to localize the visual cortex (VC). The flickering (7.5 Hz) B/W wedge (width in polar angle: 24°) performed a full clockwise rotation in the visual field, covering 30 different positions in 90 seconds (see Bianciardi et al, 2009a for additional details). (B) Areas in the brain that respond to the wedge (Figure 1A) across all rotations form region of interest ROIVC (orange, shown for an example data set: Experiment 1, slice=19).
Figure 2
Figure 2
(A) Sample data set (Experiment 1), left, axial view (slice=19) and, right, sagittal views (slices=46, 56) of the spatial distribution (P<0.05 Bonferroni corrected) of signals correlating (green) and anticorrelating (red) with the seed time series in the visual cortex (VC). Negative correlations cover periventricular areas mainly around the lateral ventricles (especially lining the dorsal part of the inferior and posterior horns), the third ventricle and the fourth ventricle. (B) Average time series in a region of interest in the VC (ROIVC, green) and in anticorrelating (AC) ROI (ROIAC, red) for the same data set shown in (A), after (solid lines) and before (dash-dotted lines) physiologic noise correction. The amplitude of spontaneous activity in both (C) ROIVC and (D) ROIAC decreased during the fixation condition with respect to resting with the eyes closed (P<0.001). The amplitude of motion-related effects did not change across conditions in either of the two areas (at a significance level P<0.05). Error bars display the amplitude average±standard error (s.e.) over eight subjects. Pearson correlation value between the time series in ROIAC during resting with the eyes closed and (E) respiration volume (RV) and (F) cardiac-rate regressors shifted at different time lags. The average correlation was not significant for any lag time.
Figure 3
Figure 3
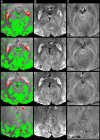
Sample data set (Experiment 2, slices=31, 32, 33, 38, eyes-closed condition), showing a zoomed view of: (A) the spatial distribution (red/green) of functional magnetic resonance imaging (fMRI) signals anticorrelating and positively correlating with the seed time series in the visual cortex; the anatomy of the lateral ventricles and of the visual cortex in (B) magnitude and (C) phase images (TE=28.5 milliseconds). Anticorrelated regions overlap with large ependymal and pial veins in proximity of ventricular and sulcal cerebrospinal fluid, respectively. Veins display dark contrast in magnitude anatomical images. In phase images, they display a dipolar-shaped contrast, which depends on the vessel orientation with respect to the static magnetic field and to the acquired slice.
Figure 4
Figure 4
Group average (±s.e.) normalized histogram count (black) of functional magnetic resonance imaging (fMRI) baseline signal amplitude between 0 and 450 (a.u.) in voxels displaying positive (A) and negative (B) blood oxygenation level dependent (BOLD) effects during resting with the eyes closed (Experiment 2). Overlayed on the signal amplitudes, we display the fitted Rician-distributed tissue components averaged (±s.e.) across subjects. Note that the fits were performed on single subject data and not directly on the group mean histogram (shown here for display purposes only), because fMRI signal amplitudes are not quantitative values. The multicomponent fit shows a larger contribution of components 1 and 3 relative to component 2 in anticorrelating region of interest, ROIAC, with respect to the visual cortex ROI, ROIVC (P<0.05), in line with a superposition of ROIAC with large vessels near cerebrospinal fluid. Similar results were also found for data of Experiment 1.
Figure 5
Figure 5
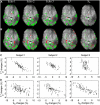
Maps of correlation (green/red=positive/negative t values) with the seed time series in the visual cortex (VC) (P<0.05 Bonferroni corrected) for a single subject (Experiment 3) for (A) Series A and (B) Series B, overlaid on a second-echo EPI-image from Series A. In Series A, echo 1/2/3 are acquired at echo times 12/28.2/44.4 milliseconds, in Series B at 20.1/36.3/52.5 milliseconds. Note that negative correlations in periventricular areas persist in T2* images and are reversed in sign in S0 maps. For each time point, the average (±s.e., error bar) T2* change relative to baseline (%) across voxels in anticorrelating (AC) region of interest, ROIAC, versus the average S0 change relative to baseline (%) across voxels in ROIAC is shown for (C) Series A and (D) Series B (rows left to right correspond to different subjects participating in Experiment 3). The anticorrelation between T2* and S0 signals at the ROI level was significant for each subject (P<10−6).
Figure 6
Figure 6
(A) Vessel with its axis parallel to B0. Simulation of the expected blood oxygenation level dependent (BOLD)-functional magnetic resonance imaging (fMRI) signal changes (SC, %) in periventricular and perisulcal areas due to increases in blood volume (%), for several baseline blood volume fractions vBL (see legend) and blood oxygenation Y=0.6. For this vessel orientation, changes in Y up to 0.7 only minimally affect T2*BLOOD and do not affect BOLD signal level (the dephasing factor fDEPH is equal to 1 for any vBL and Y). A baseline vBL of 0.05 was only used for 3 and 1.5 T simulated data, considering the lower spatial resolution (here, we assumed a 3 × 3 × 3 mm3 voxel volume) usually used at three these field strengths. The acquisition parameters and the assumed T1 and T2* values for the various tissue compartments are explained in Table 2. A SC of −1.8%, found in periventricular and perisulcal areas on average across subjects during resting with the eyes closed (Experiment 1, see Figure 2D), is marked with a horizontal black line. This signal decrease may be generated by a blood volume change of about 4% to 7%, assuming a resting vBL of 0.2 to 0.3 at 7 T. Note that, for the same baseline vBL and blood volume change, the induced signal decrease is smaller at lower field strengths. (B) Vessel with its axis perpendicular to B0. The calculated BOLD-fMRI SCs (%) decrease more sharply with the blood volume (%) compared with (A) for baseline Y=0.6 (dY/Y=0%). Increases in blood oxygenation counteract this effect (e.g., see curves with dY/Y=4.4% or 16.7%). This is because fDEPH decreases with vBL and increases with Y for vessels with their axis perpendicular to B0.

References

    1. Allison JD, Meador KJ, Loring DW, Figueroa RE, Wright JC. Functional MRI cerebral activation and deactivation during finger movement. Neurology. 2000;54:135–142. - PubMed
    1. Bianciardi M, Fukunaga M, van Gelderen P, Horovitz SG, de Zwart JA, Duyn JH. Modulation of spontaneous fMRI activity in human visual cortex by behavioral state. Neuroimage. 2009a;45:160–168. - PMC - PubMed
    1. Bianciardi M, Fukunaga M, van Gelderen P, Horovitz SG, de Zwart JA, Shmueli K, Duyn JH. Sources of functional magnetic resonance imaging signal fluctuations in the human brain at rest: a 7 T study. Magn Reson Imaging. 2009b;27:1019–1029. - PMC - PubMed
    1. Birn RM, Diamond JB, Smith MA, Bandettini PA. Separating respiratory-variation-related fluctuations from neuronal-activity-related fluctuations in fMRI. Neuroimage. 2006;31:1536–1548. - PubMed
    1. Blockley NP, Jiang L, Gardener AG, Ludman CN, Francis ST, Gowland PA. Field strength dependence of R1 and R2* relaxivities of human whole blood to ProHance, Vasovist, and deoxyhemoglobin. Magn Reson Med. 2008;60:1313–1320. - PubMed

Publication types

MeSH terms