

In vivo observation of intracellular oximetry in perfluorocarbon-labeled glioma cells and chemotherapeutic response in the CNS using fluorine-19 MRI
- PMID: 20860007
- PMCID: PMC2965778
- DOI: 10.1002/mrm.22506
In vivo observation of intracellular oximetry in perfluorocarbon-labeled glioma cells and chemotherapeutic response in the CNS using fluorine-19 MRI
Abstract
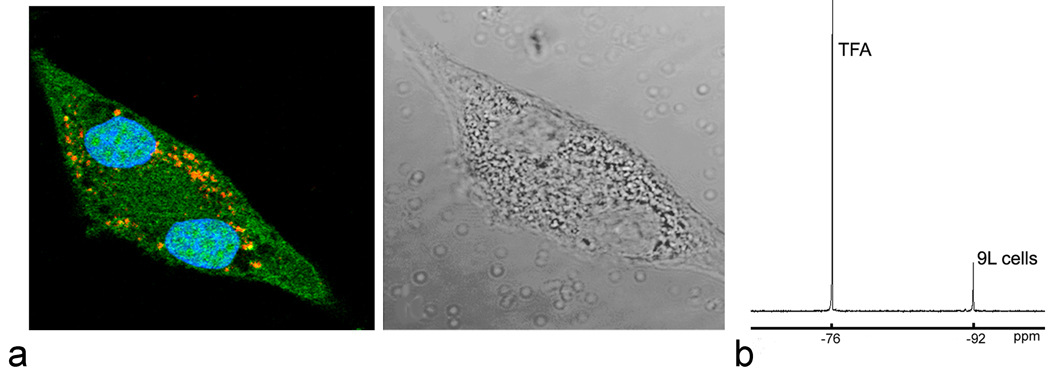
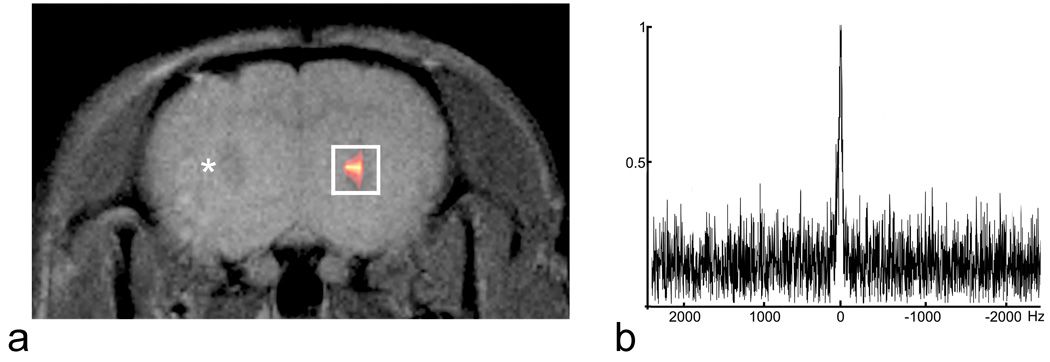
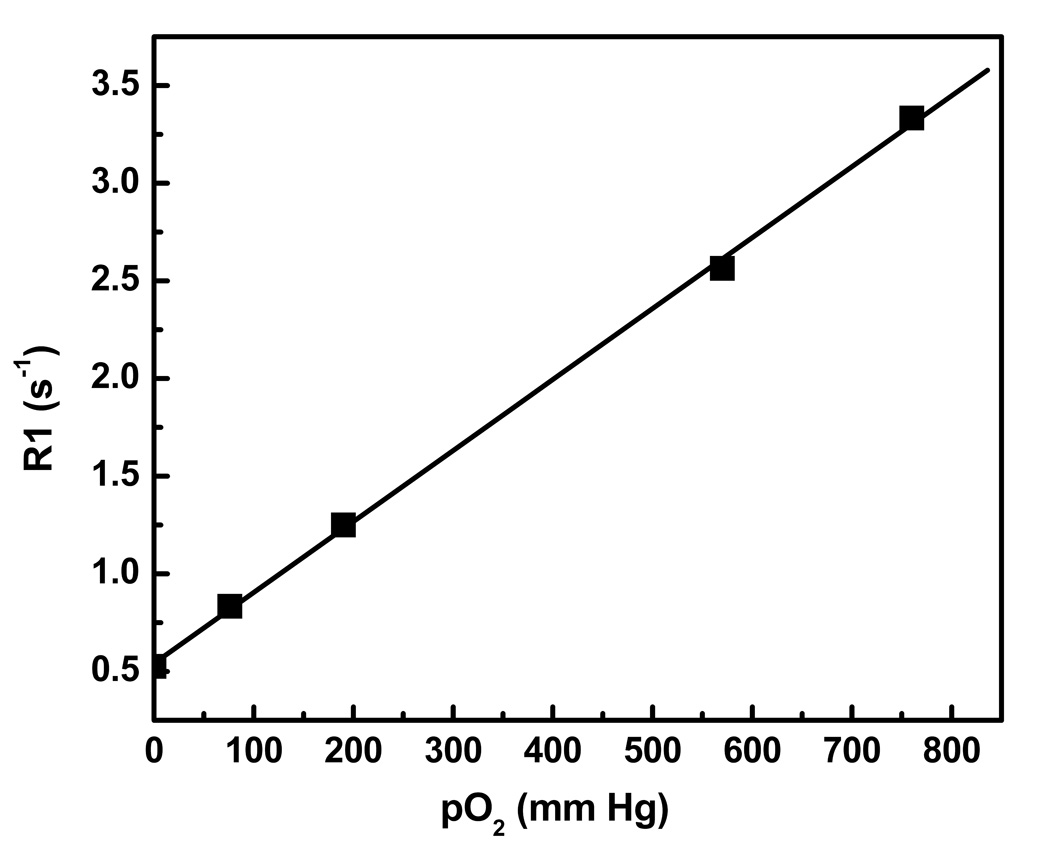
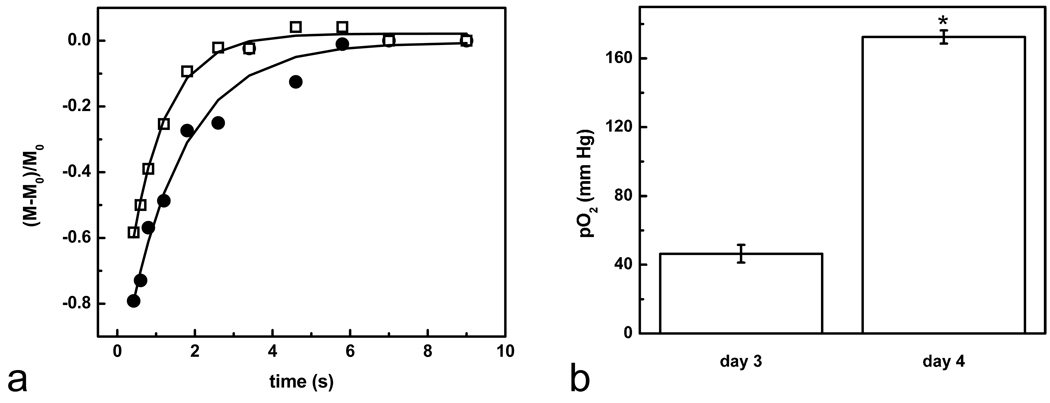
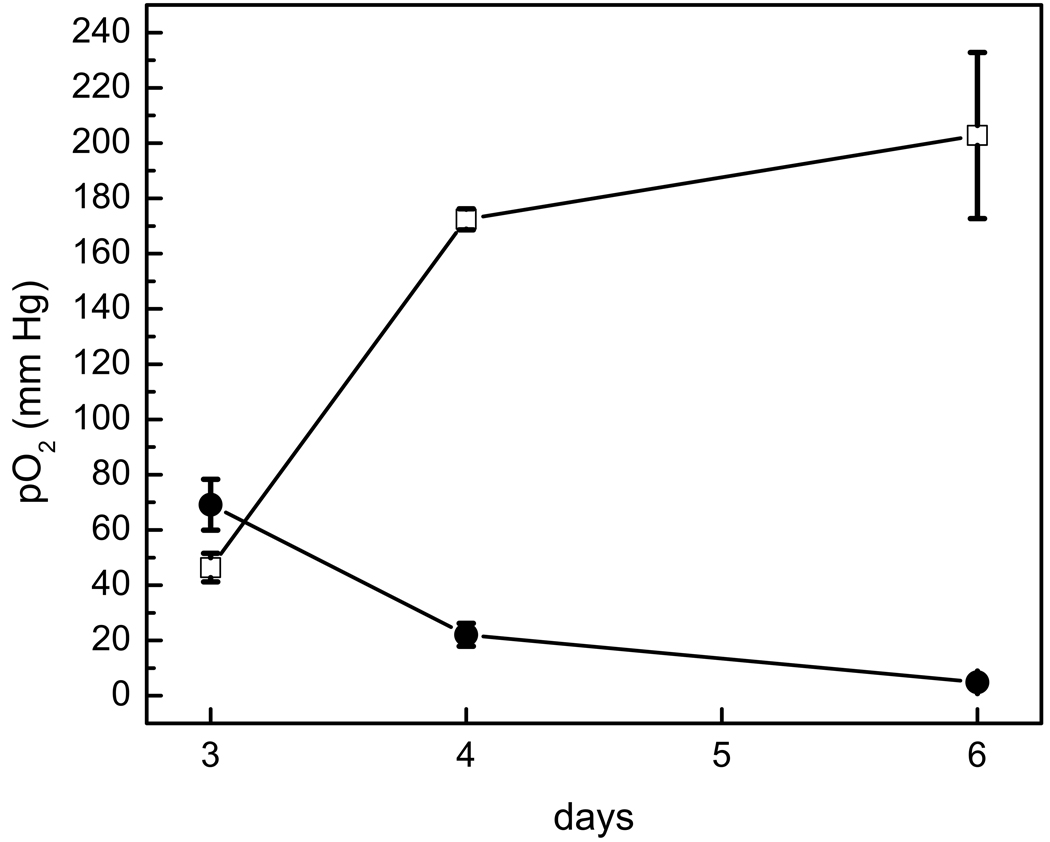
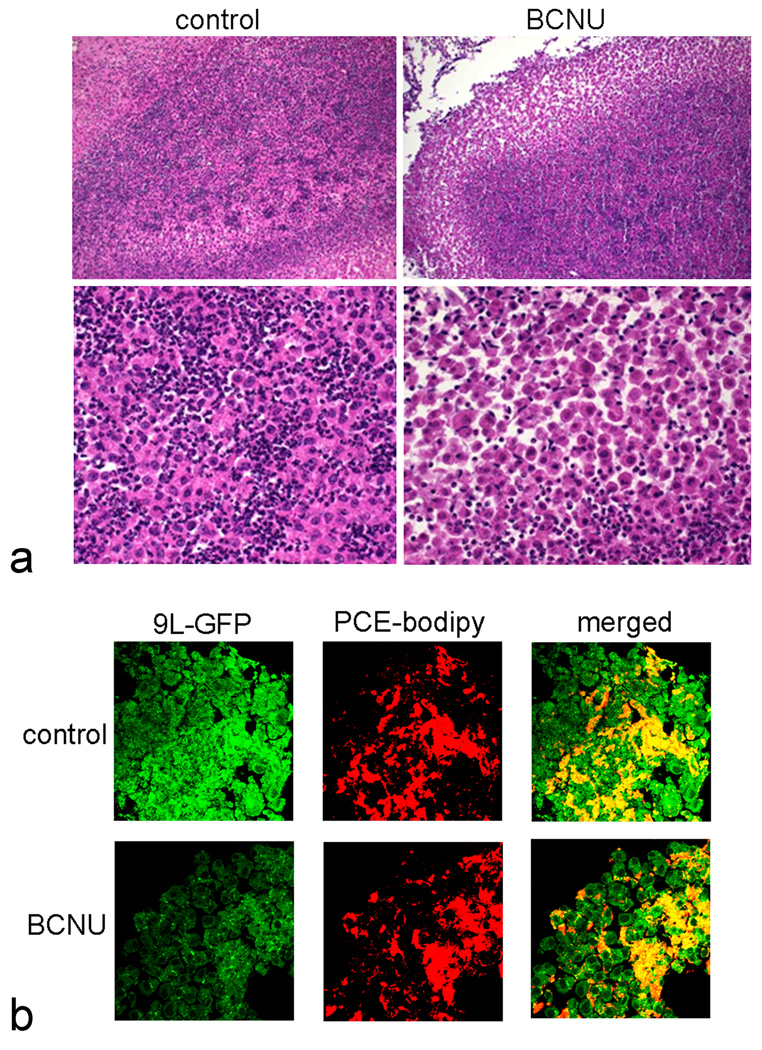
Preclinical development of therapeutic agents against cancer could greatly benefit from noninvasive markers of tumor killing. Potentially, the intracellular partial pressure of oxygen (pO(2) ) can be used as an early marker of antitumor efficacy. Here, the feasibility of measuring intracellular pO(2) of central nervous system glioma cells in vivo using (19) F magnetic resonance techniques is examined. Rat 9L glioma cells were labeled with perfluoro-15-crown-5-ether ex vivo and then implanted into the rat striatum. (19) F MRI was used to visualize tumor location in vivo. The mean (19) F T(1) of the implanted cells was measured using localized, single-voxel spectroscopy. The intracellular pO(2) in tumor cells was determined from an in vitro calibration curve. The basal pO(2) of 9L cells (day 3) was determined to be 45.3 ± 5 mmHg (n = 6). Rats were then treated with a 1 × LD10 dose of bischloroethylnitrosourea intravenously and changes in intracellular pO(2) were monitored. The pO(2) increased significantly (P = 0.042, paired T-test) to 141.8 ± 3 mmHg within 18 h after bischloroethylnitrosourea treatment (day 4) and remained elevated (165 ± 24 mmHg) for at least 72 h (day 6). Intracellular localization of the perfluoro-15-crown-5-ether emulsion in 9L cells before and after bischloroethylnitrosourea treatment was confirmed by histological examination and fluorescence microscopy. Overall, noninvasive (19) F magnetic resonance techniques may provide a valuable preclinical tool for monitoring therapeutic response against central nervous system or other deep-seated tumors.
Copyright © 2010 Wiley-Liss, Inc.
Figures
Similar articles
-
Prognostic Value of Fluorine-19 MRI Oximetry Monitoring in cancer.Mol Imaging Biol. 2022 Apr;24(2):208-219. doi: 10.1007/s11307-021-01648-3. Epub 2021 Oct 27. Mol Imaging Biol. 2022. PMID: 34708396 Review.
-
In vivo intracellular oxygen dynamics in murine brain glioma and immunotherapeutic response of cytotoxic T cells observed by fluorine-19 magnetic resonance imaging.PLoS One. 2013 May 8;8(5):e59479. doi: 10.1371/journal.pone.0059479. Print 2013. PLoS One. 2013. PMID: 23667419 Free PMC article.
-
Repeated assessment of orthotopic glioma pO(2) by multi-site EPR oximetry: a technique with the potential to guide therapeutic optimization by repeated measurements of oxygen.J Neurosci Methods. 2012 Feb 15;204(1):111-117. doi: 10.1016/j.jneumeth.2011.10.026. Epub 2011 Nov 4. J Neurosci Methods. 2012. PMID: 22079559 Free PMC article.
-
Skeletal muscle and glioma oxygenation by carbogen inhalation in rats: a longitudinal study by EPR oximetry using single-probe implantable oxygen sensors.Adv Exp Med Biol. 2014;812:97-103. doi: 10.1007/978-1-4939-0620-8_13. Adv Exp Med Biol. 2014. PMID: 24729220 Free PMC article.
-
Tumor pO₂ as a surrogate marker to identify therapeutic window during metronomic chemotherapy of 9L gliomas.Adv Exp Med Biol. 2011;701:107-13. doi: 10.1007/978-1-4419-7756-4_15. Adv Exp Med Biol. 2011. PMID: 21445776 Free PMC article.
Cited by
-
¹⁹F MRI tracer preserves in vitro and in vivo properties of hematopoietic stem cells.Cell Transplant. 2013;22(1):87-97. doi: 10.3727/096368912X653174. Epub 2012 Aug 2. Cell Transplant. 2013. PMID: 22862925 Free PMC article.
-
Enhanced Fluorine-19 MRI Sensitivity using a Cryogenic Radiofrequency Probe: Technical Developments and Ex Vivo Demonstration in a Mouse Model of Neuroinflammation.Sci Rep. 2017 Aug 29;7(1):9808. doi: 10.1038/s41598-017-09622-2. Sci Rep. 2017. PMID: 28851959 Free PMC article.
-
Mapping in vivo tumor oxygenation within viable tumor by 19F-MRI and multispectral analysis.Neoplasia. 2013 Nov;15(11):1241-50. doi: 10.1593/neo.131468. Neoplasia. 2013. PMID: 24339736 Free PMC article.
-
Prognostic Value of Fluorine-19 MRI Oximetry Monitoring in cancer.Mol Imaging Biol. 2022 Apr;24(2):208-219. doi: 10.1007/s11307-021-01648-3. Epub 2021 Oct 27. Mol Imaging Biol. 2022. PMID: 34708396 Review.
-
Intracellular pH measurements using perfluorocarbon nanoemulsions.J Am Chem Soc. 2013 Dec 11;135(49):18445-57. doi: 10.1021/ja407573m. Epub 2013 Nov 22. J Am Chem Soc. 2013. PMID: 24266634 Free PMC article.
References
-
- Tatum JL, Kelloff GJ, Gillies RJ, Arbeit JM, Brown JM, Chao KS, Chapman JD, Eckelman WC, Fyles AW, Giaccia AJ, Hill RP, Koch CJ, Krishna MC, Krohn KA, Lewis JS, Mason RP, Melillo G, Padhani AR, Powis G, Rajendran JG, Reba R, Robinson SP, Semenza GL, Swartz HM, Vaupel P, Yang D, Croft B, Hoffman J, Liu G, Stone H, Sullivan D. Hypoxia: importance in tumor biology, noninvasive measurement by imaging, and value of its measurement in the management of cancer therapy. Int J Radiat Biol. 2006;82:699–757. - PubMed
-
- Brizel DM, Dodge RK, Clough RW, Dewhirst MW. Oxygenation of head and neck cancer: changes during radiotherapy and impact on treatment outcome. Radiother Oncol. 1999;53:113–117. - PubMed
-
- Lyng H, Sundfor K, Rofstad EK. Oxygen tension in human tumours measured with polarographic needle electrodes and its relationship to vascular density, necrosis and hypoxia. Radiother Oncol. 1997;44:163–169. - PubMed
-
- Hutchison GJ, Valentine HR, Loncaster JA, Davidson SE, Hunter RD, Roberts SA, Harris AL, Stratford IJ, Price PM, West CM. Hypoxia-inducible factor 1alpha expression as an intrinsic marker of hypoxia: correlation with tumor oxygen, pimonidazole measurements, and outcome in locally advanced carcinoma of the cervix. Clin Cancer Res. 2004;10:8405–8412. - PubMed
Publication types
MeSH terms
Substances
Grants and funding
LinkOut - more resources
Full Text Sources
Medical
