. 2011 Jan;10(1):M110.004010.
doi: 10.1074/mcp.M110.004010. Epub 2010 Sep 21.

Prediction of the clinical outcome in invasive candidiasis patients based on molecular fingerprints of five anti-Candida antibodies in serum

Affiliations

Prediction of the clinical outcome in invasive candidiasis patients based on molecular fingerprints of five anti-Candida antibodies in serum

Aida Pitarch et al. Mol Cell Proteomics. 2011 Jan.

Abstract

Better prognostic predictors for invasive candidiasis (IC) are needed to tailor and individualize therapeutic decision-making and minimize its high morbidity and mortality. We investigated whether molecular profiling of IgG-antibody response to the whole soluble Candida proteome could reveal a prognostic signature that may serve to devise a clinical-outcome prediction model for IC and contribute to known IC prognostic factors. By serological proteome analysis and data-mining procedures, serum 31-IgG antibody-reactivity patterns were examined in 45 IC patients randomly split into training and test sets. Within the training cohort, unsupervised two-way hierarchical clustering and principal-component analyses segregated IC patients into two antibody-reactivity subgroups with distinct prognoses that were unbiased by traditional IC prognostic factors and other patients-related variables. Supervised discriminant analysis with leave-one-out cross-validation identified a five-IgG antibody-reactivity signature as the most simplified and accurate IC clinical-outcome predictor, from which an IC prognosis score (ICPS) was derived. Its robustness was confirmed in the test set. Multivariate logistic-regression and receiver-operating-characteristic curve analyses demonstrated that the ICPS was able to accurately discriminate IC patients at high risk for death from those at low risk and outperformed conventional IC prognostic factors. Further validation of the five-IgG antibody-reactivity signature on a multiplexed immunoassay supported the serological proteome analysis results. The five IgG antibodies incorporated in the ICPS made biologic sense and were associated either with good-prognosis and protective patterns (those to Met6p, Hsp90p, and Pgk1p, putative Candida virulence factors and antiapoptotic mediators) or with poor-prognosis and risk patterns (those to Ssb1p and Gap1p/Tdh3p, potential Candida proapoptotic mediators). We conclude that the ICPS, with additional refinement in future larger prospective cohorts, could be applicable to reliably predict patient clinical-outcome for individualized therapy of IC. Our data further provide insights into molecular mechanisms that may influence clinical outcome in IC and uncover potential targets for vaccine design and immunotherapy against IC.


Figures
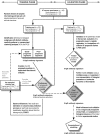
Fig. 1.
Fig. 1.
Overview of the strategy used for the development and validation of an IC prognostic prediction model based on molecular fingerprints of anti-Candida IgG antibodies in serum. The present approach combines the strengths of unsupervised and supervised methods. nT represents the training data without the jth case, and nV the test data (the jth case).
Fig. 2.
Fig. 2.
The whole soluble Candida immunome in IC. A, Silver-stained 2-DE map of the whole soluble C. albicans proteome. Protein names refer to those in Table II. Asterisks show the proteins that were identified by MS analyses in the present work. B, Representative two-dimensional reactivity profiles of serum IgG antibodies to the whole soluble Candida immunome in IC patients of the training set who had good (left) and poor (right) clinical outcomes within two months. Immunorecognized protein species are labeled (Table II).
Fig. 3.
Fig. 3.
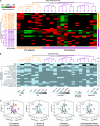
Unsupervised learning (or clustering) analyses on SERPA-based anti-Candida IgG antibody-reactivity profiling data obtained from IC patients in the training set. A, Unsupervised two-way HCA of global anti-Candida IgG antibody-reactivity patterns in IC. Heat map and dendrograms depict clustering of serum specimens (columns) and IgG antibodies (rows) from IC patients in the training set according to overall similarities in SERPA-based antibody-reactivity profiles and reactivities across the sample population, respectively. Red or green oblongs correspond to IgG antibody-reactivity levels above or below, respectively, the median value (black oblongs). Protein names refer to those in Table II. D, IC patients who died; S, IC patients who survived. B, Sample dendrogram from the hierarchical cluster with the demographic and clinical information for each IC patient. Color code of the dendrogram is the same as in panel A (on the basis of the patient outcome). Matrix is color-coded as indicated in the scales for each demographic or clinical parameter at the bottom. p values for the association between the two major sample subgroups and these variables are shown to the right of the matrix. n.a. denotes not applicable because no training IC patients (with good and poor prognoses) had multiple trauma. C, Unsupervised PCA of global anti-Candida IgG antibody-reactivity profiles in IC within a three-dimension vector space. Each circle denotes the IgG antibody-reactivity pattern of a single sample. Specimens are color-coded as indicated. Note that color codes are the same as in panels A and B. Asterisks and daggers indicate the degree of homology and homogeneity, respectively, of these antibody-reactivity patterns among the specified study groups. Only clustering data based on clinical outcomes (left panel) and three known IC prognostic factors (center and right panels) of IC patients are depicted. ARDS, adult respiratory distress syndrome.
Fig. 4.
Fig. 4.
Development of an anti-Candida IgG antibody reactivity-based prognostic predictor for IC in the training set. A, Representative two-dimensional immunoreactivity patterns of the five predictor variables (signature IgG antibodies) selected to develop the IC prognostic prediction model. See Fig. 2 for their relative position on 2-DE gels and two-dimensional immunoblots. Protein names refer to those in Table II. B, Contribution of these five predictor variables to the multivariate model before its creation. The p values for the equality tests of group means (above bars) were not greater than 0.1 (probability value to leave the model), indicating that these five predictor variables could substantially contribute to the discriminant model. Predictor variables with smaller Wilks' λ values show better discriminating abilities. C, Combined within-groups correlations of predictor variables with the standardized canonical discriminant functions. The centroids (the multidimensional center points) in the discriminant function were 1.83 (positive value) for the good-prognosis group and –4.87 (negative value) for the poor-prognosis group. A positive weight value in the pooled within-groups correlations indicates that seroprevalence of the specified predictor variable is higher in IC survivors than in IC non-survivors, and vice versa (shaded area). D, Box-and-whisker plots of the ICPS in the training IC patients on the basis of their clinical outcome. The boxes represent the interquartile ranges (25th to 75th percentiles), the horizontal thick lines portray the medians, the black squares denote the means, the whiskers extend to 1.5 times the interquartile range, and the asterisks depict the extreme values. The dot diagrams show the distribution of ICPS values in individual IC patients. The dashed line indicates the cutoff ICPS value for a fatal outcome (shaded rectangle) as defined by ROC curve analysis.
Fig. 5.
Fig. 5.
Cross-validation and further validation of the prognostic performance of the ICPS. A, Prediction strengths of the ICPS for the specimens in LOOCV on the training set (left) and in further validation on the test set (right). Horizontal lines represent medians, and vertical lines interquartile ranges. The dashed line depicts the cutoff ICPS value for a fatal outcome (shaded rectangle) as defined by ROC curve analysis from the original training set (Fig. 4D). B, Estimated classification probabilities of a fatal clinical outcome within 2 months for each sample in the LOOCV training (left) and test (right) cohorts according to the ICPS. The sunflower diagrams show overlapped cases. Each petal or sunflower line represents an individual case (IC patient). The actual clinical-outcome is color-coded as indicated (black for a good prognosis, and white for a poor prognosis). The horizontal dashed line indicates the probability threshold (an arbitrary cutoff value of 0.5) chosen to discriminate between predicted good- and poor-prognosis patients. The vertical dashed line depicts the cutoff ICPS value for a fatal outcome (shaded rectangle). Errors in LOOCV and further validation of the IC prognostic prediction model using the five-antibody signature are shown. C, ROC curves of the ICPS for the prediction of an unfavorable (thick line) or favorable (thin line) clinical outcome within 2 months in IC patients of the LOOCV training (left) and test (right) sets. The cutoff ICPS value to distinguish IC patients with good and poor prognoses as estimated by ROC plots in the original training set is labeled in the curves of both cohorts. See Table IV for details.
Fig. 6.
Fig. 6.
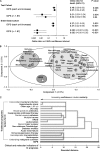
Prognostic power of the ICPS. A, Two-month mortality risk in IC patients according to the ICPS in the test and entire-data cohorts. The ICPS was modeled both as a continuous variable (where odds ratios were estimated for each unit increase) and as a categorical variable (dichotomized on the basis of the threshold defined by ROC analysis in the training set; Fig. 4C) in logistic-regression models. The squares indicate unadjusted odds ratios. The circles denote odds ratios adjusted for traditional IC prognostic factors, sex, age, underlying condition and hospital ward (Table I). Horizontal lines represent 95% CIs. For the ORs and p values shown, the reference category (OR = 1.00) was the lowest unit increase or an ICPS value equal to or below the threshold defined in the training set (≤ −1.67) for models that included the ICPS as a continuous or categorical variable, respectively. B, PCA of clinical and molecular indicators of IC prognosis in the test set within a two-dimension vector space. The percentages of total variance explained using the first two principal components are displayed on the corresponding axes. C, HCA of clinical and molecular clinical-outcome predictors for IC in the test cohort. The dendrogram branch length reflects the degree of relatedness among predictor variables: short branches cluster variables with high similarity whereas longer branches group those with lower correlation.
Fig. 7.
Fig. 7.
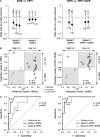
Comparison of prognostic abilities of the ICPS and models based on traditional IC prognostic factors without and with the ICPS (TPFI and TPFI+ICPS, respectively) on the test set. A, Forest plots of odds ratios for a fatal clinical outcome in testing IC patients within two months following presentation according to the ICPS, TPFI and TPFI+ICPS. The squares represent unadjusted odds ratios. The circles indicate odds ratios adjusted for sex, age, underlying condition, and hospital ward (Table I). The diamonds correspond to odds ratios adjusted for each other (model 2 or 1). Horizontal lines denote 95% CIs. The numbers below each forest plot depict the corresponding odds ratios for a fatal clinical outcome. B, Two-dimensional representation of prediction strengths of ICPS versus TPFI (left) and TPFI+ICPS (right) in the test set. The shaded rectangles depict clinical concordance in the (good/poor) outcome predictions for individual IC patients between the compared prediction models. The actual clinical-outcome is color-coded as indicated (black for a good prognosis, and white for a poor prognosis). The vertical dashed lines indicate the cutoff ICPS value for a poor prognosis, and horizontal dashed lines denote the cutoff TPFI (left) and TPFI+ICPS (right) values for a fatal outcome as defined by ROC plots. C, ROC curves of the ICPS versus TPFI (left) and TPFI+ICPS (right) for the prediction of an unfavorable clinical outcome within two months in testing IC patients. The cutoff values of the three prediction models to discriminate IC patients with good and poor prognoses as defined by ROC plots in the initial training set are labeled in their corresponding curves.
Fig. 8.
Fig. 8.
Analytical performance of the multiplexed immunoassay for simultaneous and rapid measurement of the five signature IgG antibodies in each serum sample. A, Recombinant C. albicans proteins used as diagnostic reagents in the multiplexed immunoassay. Purified and Pre-Scission protease-treated recombinant Met6p (lane 1), Ssb1p (lane 2), Gap1p/Tdh3p (lane 3), Hsp90p (lane 4), and Pgk1p (lane 5) were separated on a 10% SDS-PAGE gel and silver-stained. Lane M, molecular mass standards. B, Representative immunorecognition patterns of threefold serial dilutions of the calibrator. In addition to the five recombinant C. albicans protein dots, each multiplexed immunoblot included negative (C-; bovine serum albumin) and positive (C+; C. albicans protein extract) control dots to monitor experimental performance. Numbers below each panel depict signature IgG antibody concentration. C, Typical multiplexed dot-blot array showing intra-assay imprecision of one serum with different signature IgG antibody concentrations in four replicates. See Supplemental Table S2 for further details. D, Representative multiplexed immunoblots depicting dilution effect (1:250–1:1000) in the assay buffer for one serum with different signature IgG antibody concentrations. E, Typical multiplexed dot-blots illustrating analytical recovery of known amounts of calibrator (0.5, 1.5, and 2.5 RU/ml signature IgG antibodies) added exogenously to one serum with different signature IgG antibody concentrations. F, Calibration curves for each signature IgG antibody. Threefold serial dilutions of a serum pool from one IC survivor and one IC nonsurvivor with an arbitrary value of 6000 RU/ml signature IgG antibodies were used as a calibrator, because no reference standards are available. The dose-response curves were fit to a four-parameter logistic-regression model. Each point represents the mean relative dot volume (for the relative concentration of the calibrator) of six different analytical assays, and bars designate S.D. G, Imprecision profiles for each signature IgG antibody. Inter-assay CVs at different concentrations of the calibrator were fit to a quadratic-regression model, and are given as the mean of different six determinations. The shaded rectangles show the portion of the curves with an optimal inter-assay imprecision. H, Dilution linearity for each signature IgG antibody. Six serum specimens with different signature IgG antibody concentrations were twofold serially diluted (from 1:250 to 1:1000) in the assay buffer. Dilution ratio and recovery are referred to the less diluted sample (1:250). I, Analytical recovery for each signature IgG antibody. Known amounts of calibrators (0.5, 1.5, and 2.5 RU/ml signature IgG antibodies) were added exogenously to six serum samples with different signature IgG antibody concentrations. In panels H and I, p values are for slope deviation from zero, each symbol designates an individual serum sample, and the numbers above or below each symbol depict the recovery percentage of signature IgG antibodies at that relative (H) dilution ratio or (I) concentration of calibrator added to the tested specimen. For clarity, the scales on the y-axes of panels H and I are different. Square brackets in the axis legends denote concentration; AU, arbitrary units; RU, reference units; CV, coefficient of variation; LOD, limit of detection; LOQ, limit of quantification; Sy/x, standard deviation about the regression line; R2, goodness-of-fit statistic.
Fig. 9.
Fig. 9.
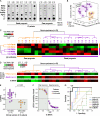
Prognostic performance of the multiplexed immunoassay on the test cohort. A, Representative multiplexed dot-blots obtained using serum specimens both from seven and four IC patients with good and poor clinical outcomes, respectively, within 2 months following presentation and from one non-IC patient (negative control; with no detectable serum levels to the five signature IgG antibodies in a two-dimensional blot). In addition to the five recombinant C. albicans protein dots, each immunoarray included negative (C-; bovine serum albumin) and positive (C+; C. albicans protein extract) control dots to monitor experimental performance. Numbers above each pattern indicate its corresponding IC-MAPS value (see panels D–G). B, Unsupervised PCA of the five-IgG antibody-reactivity profiles in testing IC patients within a three-dimension vector space. The percentages of variance explained using the first three principal components are shown on the corresponding axes. Each circle denotes the 5-IgG antibody-reactivity pattern of a single serum sample. Samples are color-coded as depicted. The color-shaded areas represent clustering of specimens. The asterisk and dagger indicate the degree of homology and homogeneity, respectively, of these antibody-reactivity patterns between the specified groups. C, Unsupervised two-way HCA of the five-IgG antibody-reactivity profiles (rows) and serum specimens (columns) from testing IC patients. Red or green oblongs correspond to IgG antibody-reactivity levels above or below, respectively, the median value (black oblongs). Protein names refer to those in Table II. D, IC patients who died; S, IC patients who survived. D, Good/poor prognosis signature averages and the IC-MAPS (in LOOCV) for each testing IC patient. Sample dendrogram is the same as in panel C. Matrixes are color-coded as shown in the corresponding scales. Good-prognosis signature IgG antibodies were those to Met6p, Hsp90p and Pgk1p, whereas poor-prognosis signature IgG antibodies were those to Ssb1p and Gap1p/Tdh3p (see panel C). E, Prediction strength of the IC-MAPS for testing IC specimens in LOOCV. Horizontal lines depict medians, and vertical lines interquartile ranges. The dashed line represents the cutoff IC-MAPS value for a fatal outcome (shaded rectangle) as determined by ROC plots (see panel G). F, Estimated classification probabilities of a fatal clinical outcome within two months for each testing IC sample in LOOCV according to the IC-MAPS. The actual clinical-outcome is color-coded as depicted. The horizontal dashed line portrays the probability threshold (an arbitrary cutoff value of 0.5) chosen to discriminate between predicted good and poor clinical-outcome patients. The vertical dashed line indicates the cutoff IC-MAPS value for a fatal outcome (shaded rectangle) as defined by ROC analysis (panel G). G, ROC curves of the IC-MAPS (in LOOCV) and individual signature IgG antibodies for the prediction of an unfavorable clinical outcome within 2 months following presentation in testing IC patients. The prognostic threshold for the IC-MAPS is labeled. Dashed curves indicate that direction of the corresponding models (signature Ssb1p and Gap1p/Tdh3p IgG antibodies) for clinical-outcome prediction in IC is distinct from the remaining univariate or multivariate models.

Similar articles

Cited by

References

    1. Pfaller M. A., Diekema D. J. (2007) Epidemiology of invasive candidiasis: a persistent public health problem. Clin. Microbiol. Rev. 20, 133–163 - PMC - PubMed
    1. Pappas P. G. (2006) Invasive candidiasis. Infect. Dis. Clin. North Am. 20, 485–506 - PubMed
    1. Eggimann P., Garbino J., Pittet D. (2003) Epidemiology of Candida species infections in critically ill non-immunosuppressed patients. Lancet Infect. Dis. 3, 685–702 - PubMed
    1. Falagas M. E., Apostolou K. E., Pappas V. D. (2006) Attributable mortality of candidemia: a systematic review of matched cohort and case-control studies. Eur. J. Clin. Microbiol. Infect. Dis. 25, 419–425 - PubMed
    1. Uzun O., Anaissie E. J. (2000) Predictors of outcome in cancer patients with candidemia. Ann. Oncol. 11, 1517–1521 - PubMed

Publication types

MeSH terms

LinkOut - more resources