. 2010 Nov;24(11):2139-51.
doi: 10.1210/me.2010-0134. Epub 2010 Sep 22.

PPARgamma-dependent regulation of adenylate cyclase 6 amplifies the stimulatory effect of cAMP on renin gene expression

Affiliations

PPARgamma-dependent regulation of adenylate cyclase 6 amplifies the stimulatory effect of cAMP on renin gene expression

Michael Desch et al. Mol Endocrinol. 2010 Nov.

Abstract

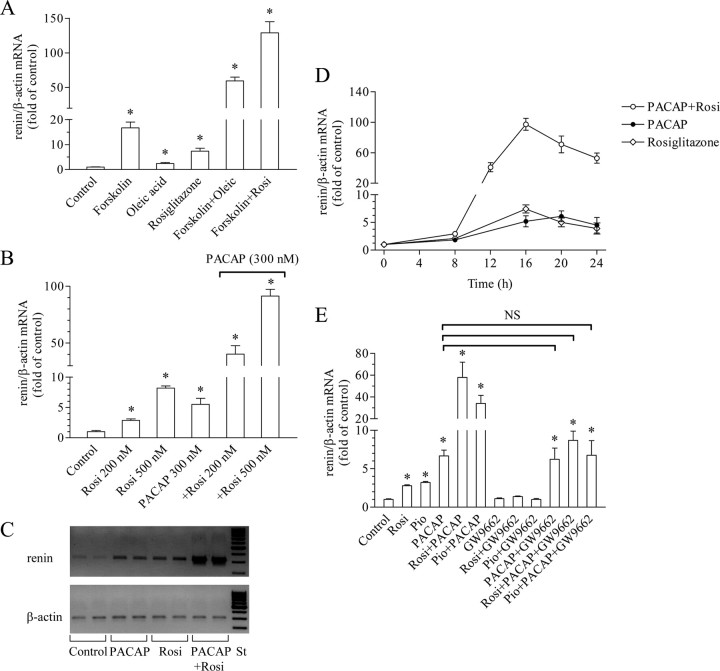
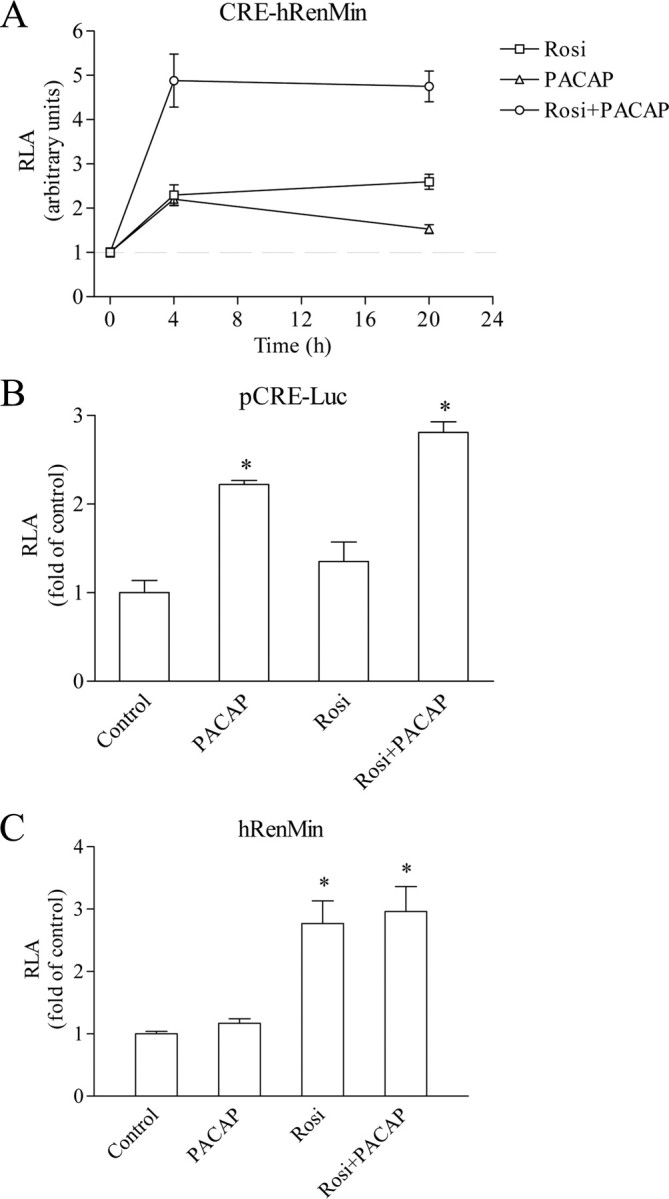
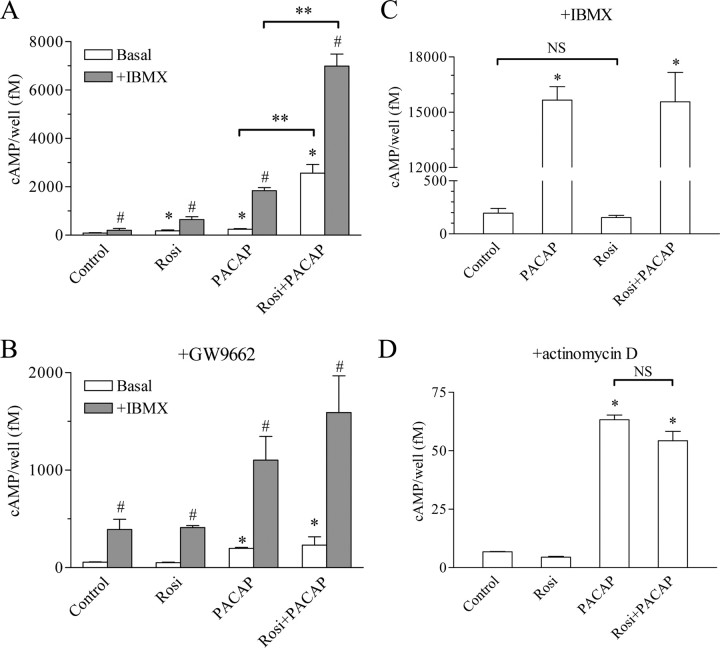
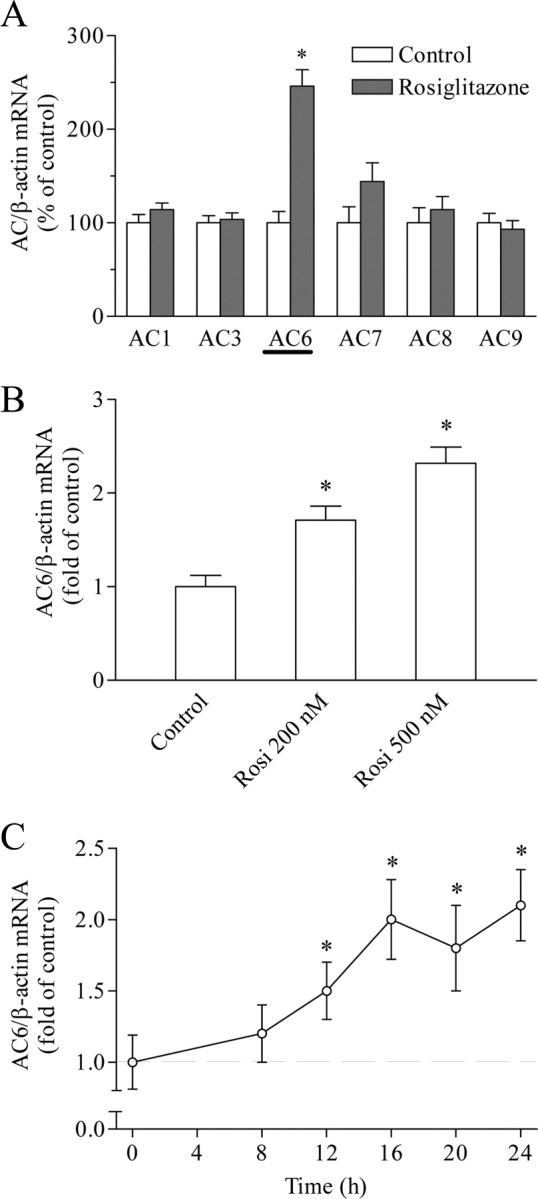
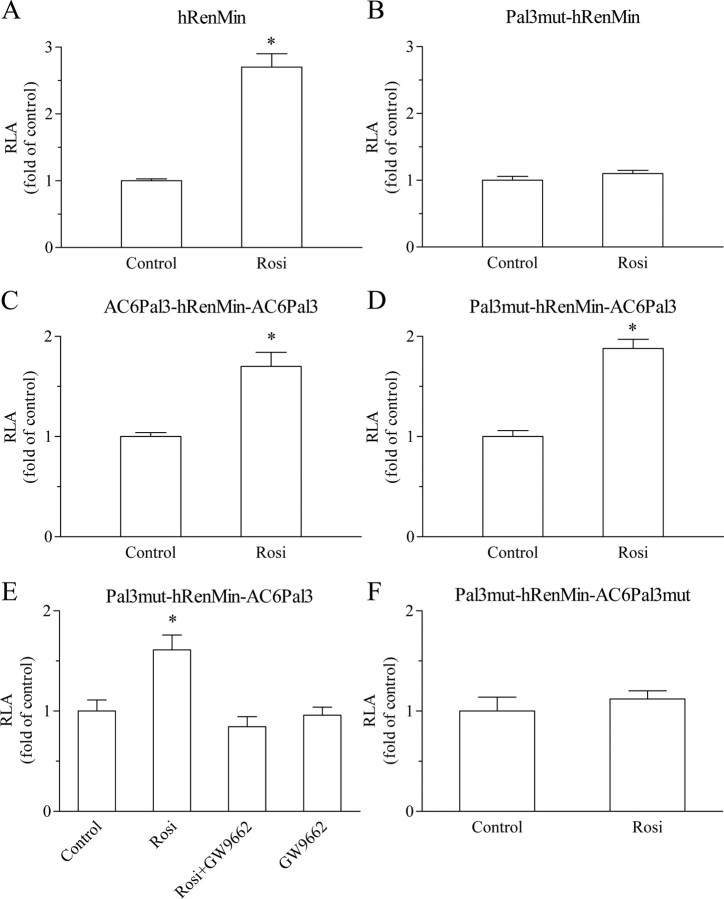
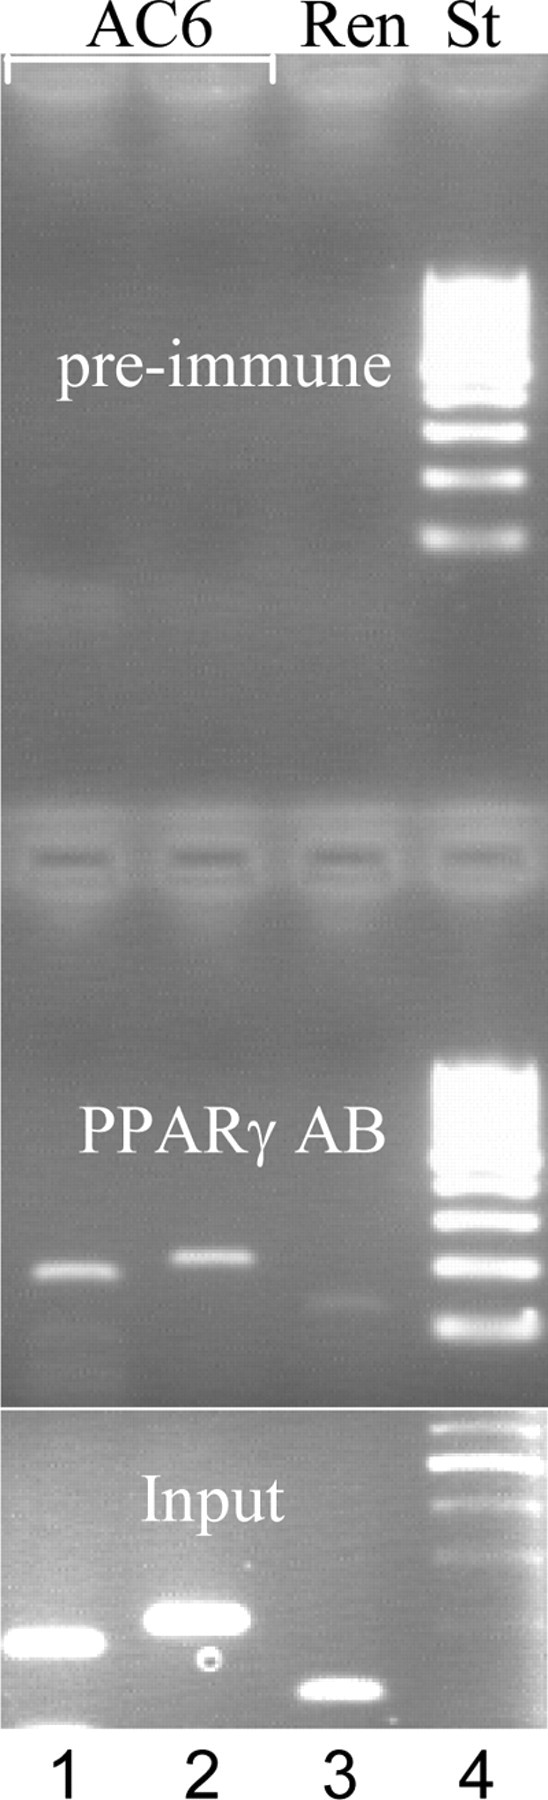
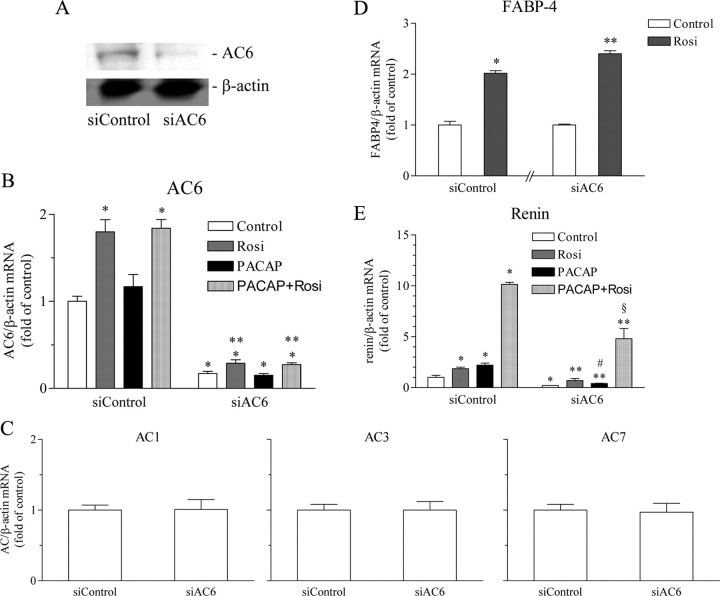
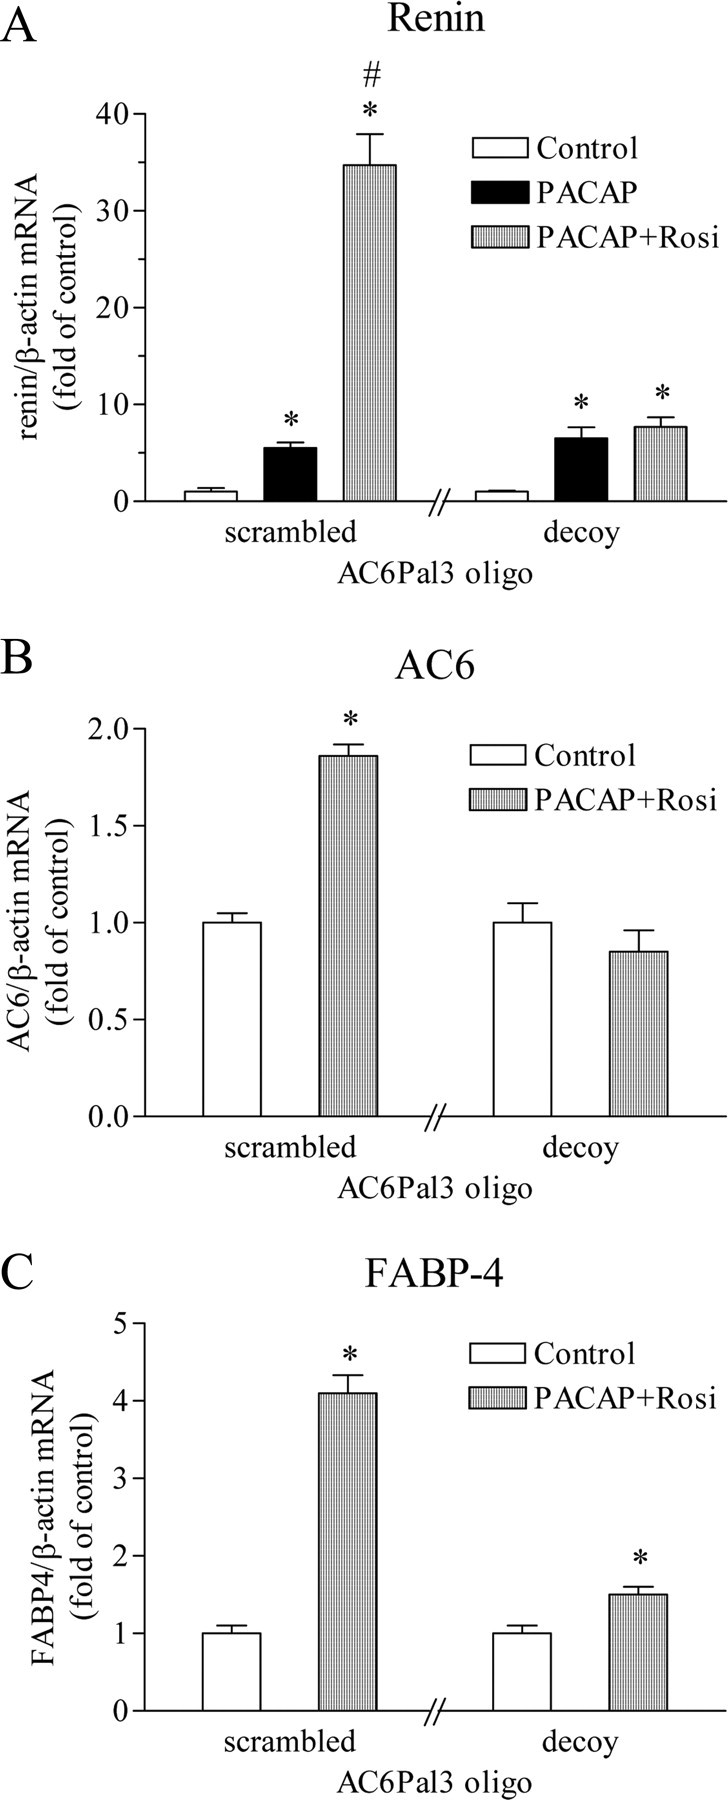
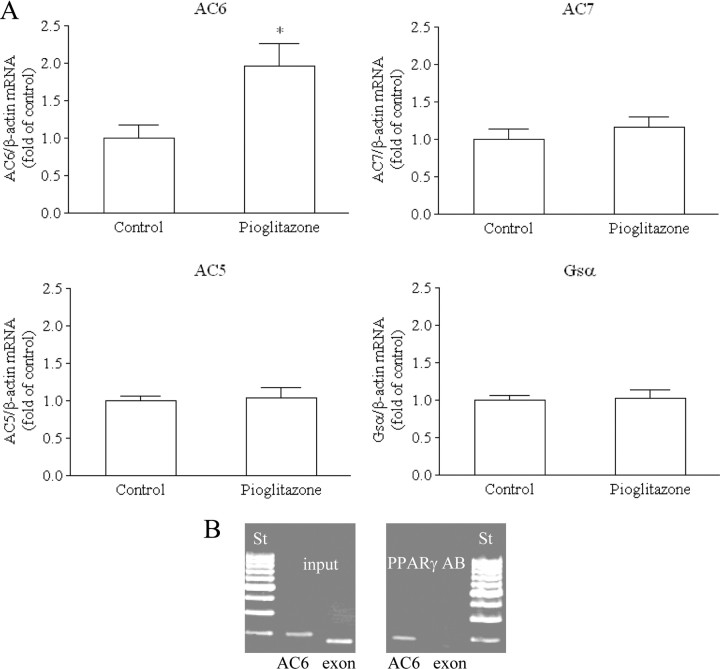
The second messenger cAMP plays an important role in the regulation of renin gene expression. Nuclear receptor peroxisome proliferator-activated receptor-γ (PPARγ) is known to stimulate renin gene transcription acting through PPARγ-binding sequences in renin promoter. We show now that activation of PPARγ by unsaturated fatty acids or thiazolidinediones drastically augments the cAMP-dependent increase of renin mRNA in the human renin-producing cell line Calu-6. The underlying mechanism involves potentiation of agonist-induced cAMP increase and up-regulation of adenylate cyclase 6 (AC6) gene expression. We identified a palindromic element with a 3-bp spacer (Pal3) in AC6 intron 1 (AC6Pal3). AC6Pal3 bound PPARγ and mediated trans-activation by PPARγ agonist. AC6 knockdown decreased basal renin mRNA level and attenuated the maximal PPARγ-dependent stimulation of the cAMP-induced renin gene expression. AC6Pal3 decoy oligonucleotide abrogated the PPARγ-dependent potentiation of cAMP-induced renin gene expression. Treatment of mice with PPARγ agonist increased AC6 mRNA kidney levels. Our data suggest that in addition to its direct effect on renin gene transcription, PPARγ "sensitizes" renin gene to cAMP via trans-activation of AC6 gene. AC6 has been identified as PPARγ target gene with a functional Pal3 sequence.


Figures

Fig. 1.
Fig. 1.
PPARγ agonists potentiate the cAMP-induced stimulation of renin gene expression. A, Effect of the PPARγ agonists oleic acid (250 μm) and rosiglitazone (500 nm) on the stimulation of renin gene expression by the direct AC activator forskolin (5 μm). B, Effect of the PPARγ agonist rosiglitazone (200 or 500 nm) on the stimulation of renin gene expression by the membrane receptor-binding AC activator PACAP (300 nm). C, Representative bands of amplified renin and β-actin cDNA fragments. Total RNA was isolated form Calu-6 cells incubated for 16 h as indicated (rosiglitazone was applied at 500 nm, PACAP at 300 nm). After reverse transcription, cDNA was amplified with the corresponding primers in real-time PCR. PCR was terminated in the linear phase of amplification, and the samples were loaded onto 2% agarose gel. St, Length standard. D, Time course of the effect of rosiglitazone (500 nm), PACAP (300 nm), or the combination of both on renin gene expression. E, The PPARγ antagonist GW9662 (1 μm) abrogates the potentiation of PACAP (300 nm)-induced renin gene expression by rosiglitazone (200 nm) or pioglitazone (1 μm). NS, Not significant. Renin and β-actin (internal control) mRNA levels were quantified by real-time PCR. Unless otherwise specified, Calu-6 cells were incubated with the indicated substances for 16 h. Control cells remained untreated throughout all experiments. Rosi, Rosiglitazone; Pio, pioglitazone. The data shown are means ± sem; *, P < 0.05.
Fig. 2.
Fig. 2.
Summation of the trans-activating effects of PPARγ and cAMP on renin promoter. A, Time course of the effect of rosiglitazone (500 nm), PACAP (300 nm), or the combination of both on the activity of CRE-hRenMin promoter construct. B, Effect of rosiglitazone (500 nm), PACAP (300 nm), or the combination of both on the activity of a CRE-driven reporter construct (pCRE-Luc). C, Effect of rosiglitazone (500 nm), PACAP (300 nm), or the combination of both on the activity of hRenMin promoter construct that lacks functional CRE. Calu-6 cells were incubated for 16 h with the indicated substances. Control cells remained untreated. RLA, Relative luciferase activity; Rosi, rosiglitazone. The data shown are means ± sem; *, P < 0.05.
Fig. 3.
Fig. 3.
Rosiglitazone potentiates the PACAP-induced cAMP increase. A and B, Effect of rosiglitazone (500 nm), PACAP (300 nm), or the combination of both on the cAMP accumulation. Calu-6 cells were incubated for 16 h with the above mentioned substances and without (A) or with the PPARγ antagonist GW9662 (1 μm) (B). Cells were incubated for additional 15 min with the PDE inhibitor IBMX (100 μm) where indicated. C, Rosiglitazone is not an AC activator. Effect of rosiglitazone (500 nm), PACAP (300 nm), or the combination of both on AC activity. Calu-6 cells were incubated for 5 min with the above mentioned substances after a 15-min preincubation with 100 μm IBMX. Under these conditions, the cAMP accumulation is directly proportional to AC activity. D, The potentiation of the PACAP-induced cAMP increase by rosiglitazone requires intact transcription. Effect of rosiglitazone (500 nm), PACAP (300 nm), or the combination of both on the cAMP levels in the presence of the transcriptional inhibitor actinomycin D (10 μm). Calu-6 cells were incubated for 16 h with the indicated substances. Rosi, Rosiglitazone. The data shown are means ± sem; *, P < 0.05 relative to control; #, P < 0.05 relative to the corresponding cAMP level in the absence of IBMX; **, P < 0.05 as indicated. NS, Not significant.
Fig. 4.
Fig. 4.
Expression of ACs in Calu-6 cells. A, Rosiglitazone was applied for 16 h at 500 nm. Control cells remained untreated. B, Regulation of AC6 gene expression by rosiglitazone (200 or 500 nm for 16 h). Control cells remained untreated. C, Time course of the effect of rosiglitazone (500 nm), on AC6 gene expression. ACs and β-actin (internal control) mRNA levels were quantified by real-time PCR. Rosi, Rosiglitazone. The data shown are means ± sem; *, P < 0.05.
Fig. 5.
Fig. 5.
Identification of functional Pal3 site in AC6 intron 1 (AC6Pal3). Transcriptional activity of hRenMin (A), Pal3mut-hRenMin (B), AC6Pal3-hRenMin-AC6Pal3 (C), Pal3mut-hRenMin-AC6Pal3 (D and E), and Pal3mut-hRenMin-AC6Pal3mut (F). Construct hRenMin represents the hRenMin that contains endogenous renin Pal3 PPARγ-binding site at −148 to −134. Construct Pal3mut-hRenMin does not contain functional PPARγ-binding site (because of silent mutation of Pal3). Construct AC6Pal3-hRenMin-AC6Pal3 contains AC6Pal3 site in place of the endogenous hRen-Pal3 and a second AC6Pal3 fused to the 3′-end of the hRenMin. Construct Pal3mut-hRenMin-AC6Pal3 contains mutated endogenous Pal3 and wild-type AC6Pal3 fused to the 3′-end of the hRenMin. Construct Pal3mut-hRenMin-AC6Pal3mut contains mutated endogenous Pal3 and mutated AC6Pal3 fused to the 3′-end of the hRenMin (see also Table 1). Calu-6 cells were treated with rosiglitazone (500 nm), GW9662 (1 μm), or the combination of both for 16 h as indicated. Control cells remained untreated. RLA, Relative luciferase activity; Rosi, rosiglitazone. The data shown are means ± sem; *, P < 0.05.
Fig. 6.
Fig. 6.
PPARγ binds to AC6 intron 1 in ChIP experiments with nuclear extract from Calu-6 cells. Two different primer pairs were used to amplify the Pal3 containing region of AC6 intron 1 (lanes 1 and 2). Primers amplifying a fragment from hRen exon 10 (Ren) were used as negative control (lane 3). Cross-linked Calu-6 nuclear extracts were precipitated with anti-PPARγ antibody (Santa Cruz Biotechnology, Inc.) or preimmune antigoat antibody where indicated (upper panel). After reversal of cross-linking, DNA was isolated and PCR amplified. The input samples (diluted 1:10) were not antibody-precipitated and served as a positive control (lower panel). St, Length standard (lane 4).
Fig. 7.
Fig. 7.
Knockdown of AC6 through RNA interference attenuates the maximal stimulation of renin gene expression induced by the combination of PACAP and rosiglitazone. Calu-6 cells were transfected with nontargeting siRNA as control (siControl) or with siAC6. A, Efficacy of the knockdown: AC6 and β-actin (internal control) immunoblot. B, Efficacy of the knockdown: AC6 mRNA expression. AC6 and β-actin (internal control) mRNA levels were quantified by real-time PCR. C, Specificity of the knockdown: AC1, AC3, and AC7 mRNA expression; ACs and β-actin (internal control) mRNA levels were quantified by real-time PCR. D, Specificity of the knockdown: preserved inducibility the classical PPARγ-regulated gene FABP-4. FABP-4 and β-actin (internal control) mRNA levels were quantified by real-time PCR. E, Effect of AC6 deficiency on renin mRNA levels. Renin and β-actin (internal control) mRNA levels were quantified by real-time PCR. Rosiglitazone was applied at 500 nm and PACAP at 300 nm. Calu-6 cells were incubated for 16 h as indicated. Rosi, Rosiglitazone. The data shown are means ± sem; *, P < 0.05 relative to siControl-Control; **, P < 0.05 relative to siAC6-Control; #, P < 0.05 relative to siControl-PACAP; §, P < 0.05 relative to siControl-PACAP + Rosi.
Fig. 8.
Fig. 8.
Targeting of AC6Pal3 by decoy oligonucleotide abrogates the potentiation of PACAP-induced renin mRNA expression by rosiglitazone. Calu-6 cells were incubated for 16 h with 25 μm double-stranded decoy oligonucleotide containing AC6Pal3 or double-stranded scrambled AC6Pal3 oligonucleotide, which served as control. Renin (A), AC6 (B), or FABP-4 (C), together with β-actin (internal control) mRNA levels, were quantified by real-time PCR. Rosiglitazone was applied at 500 nm and PACAP at 300 nm. Rosi, Rosiglitazone. The data shown are means ± sem; *, P < 0.05 relative to the corresponding control; #, P < 0.05 relative to scrambled-PACAP.
Fig. 9.
Fig. 9.
Mice were fed with control (n = 6) or pioglitazone-containing diet (0.2 g/kg, n = 9). A, AC 5, 6, 7, Gsα, and β-actin (internal control) mRNA levels in kidneys were quantified by real-time PCR. The data shown are means ± sem; *, P < 0.05. B, PPARγ binds to AC6 intron 1 in ChIP experiments with mouse kidney nuclear extracts. Primers amplifying the Pal3 containing region of mouse AC6 intron 1 (AC6) or a fragment from mouse PPARγ exon 2 (exon) as negative control were used. Cross-linked mouse kidney nuclear extracts were precipitated with anti-PPARγ antibody (Santa Cruz Biotechnology, Inc.) (right panel). After reversal of cross-linking, DNA was isolated and PCR amplified. The input samples (diluted 1:10) were not antibody precipitated and served as a positive control (left panel). St, Length standard; AB, antibody.

References

    1. Castrop H, Höcherl K, Kurtz A, Schweda F, Todorov V, Wagner C2010. Physiology of kidney renin. Physiol Rev 90:607–673 - PubMed
    1. Pan L, Gross KW2005. Transcriptional regulation of renin: an update. Hypertension 45:3–8 - PubMed
    1. Todorov VT, Desch M, Schmitt-Nilson N, Todorova A, Kurtz A2007. Peroxisome proliferator-activated receptor-γ is involved in the control of renin gene expression. Hypertension 50:939–944 - PubMed
    1. Todorov VT, Desch M, Schubert T, Kurtz A2008. The Pal3 promoter sequence is critical for the regulation of human renin gene transcription by peroxisome proliferator-activated receptor-γ. Endocrinology 149:4647–4657 - PubMed
    1. Desch M, Schreiber A, Schweda F, Madsen K, Friis UG, Weatherford ET, Sigmund CD, Sequeira Lopez ML, Gomez RA, Todorov VT2010. Increased renin production in mice with deletion of peroxisome proliferator-activated receptor-γ in juxtaglomerular cells. Hypertension 55:660–666 - PMC - PubMed

Publication types

MeSH terms