. 2010 Dec;84(23):12315-24.
doi: 10.1128/JVI.01600-10. Epub 2010 Sep 22.

Immunization with different viral antigens alters the pattern of T cell exhaustion and latency in herpes simplex virus type 1-infected mice

Affiliations

Immunization with different viral antigens alters the pattern of T cell exhaustion and latency in herpes simplex virus type 1-infected mice

Sariah J Allen et al. J Virol. 2010 Dec.

Abstract

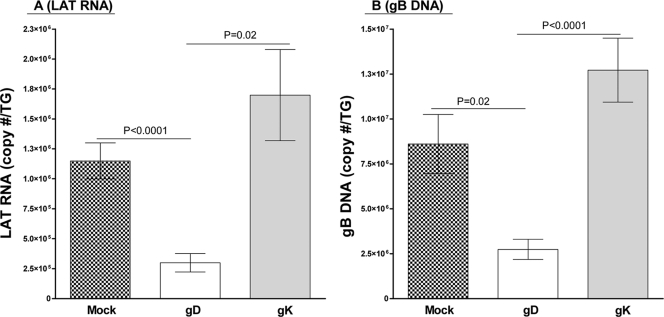
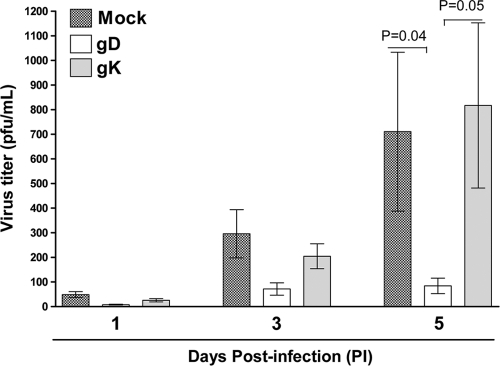
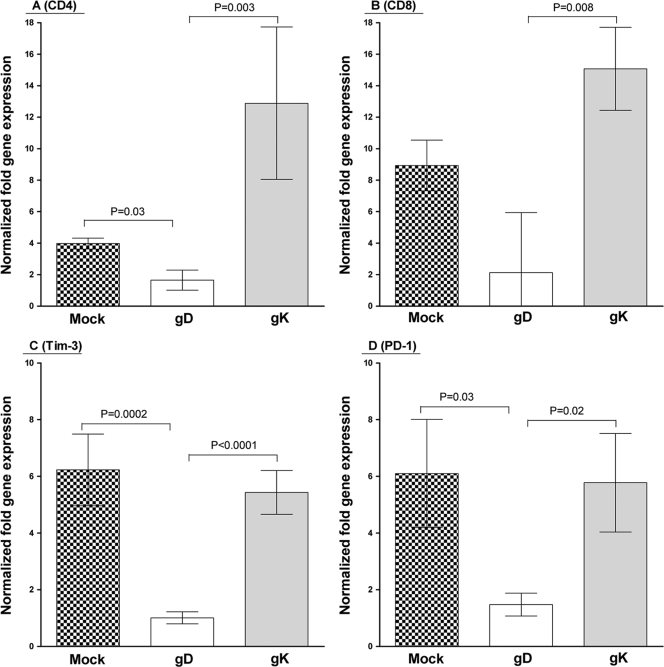
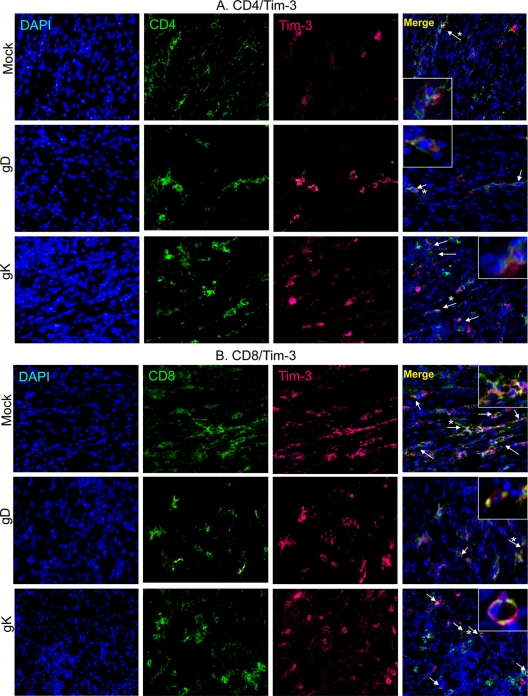
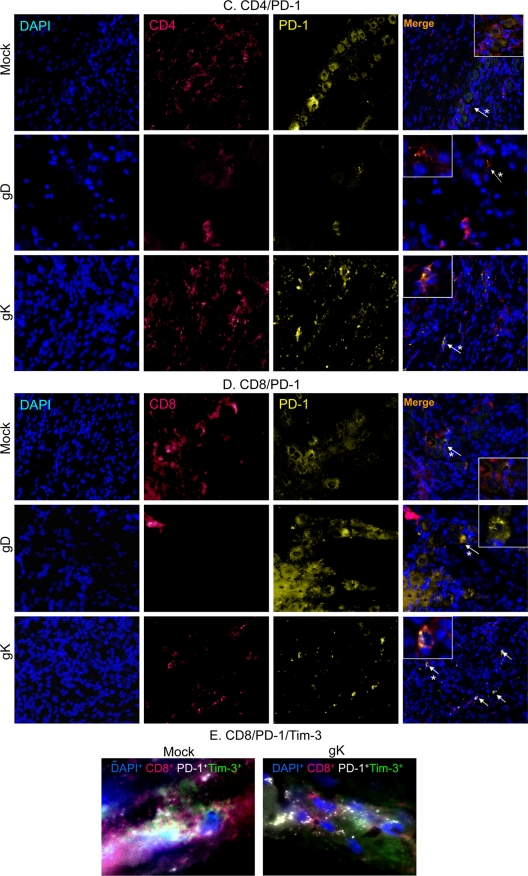
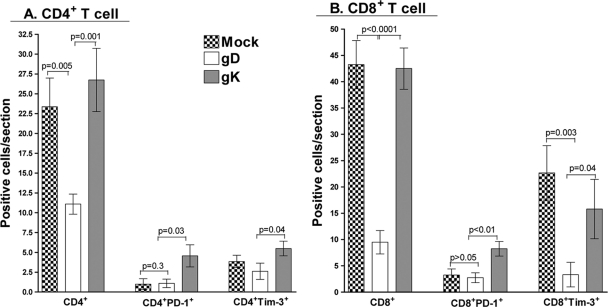
We have shown previously that immunization with herpes simplex virus type 1 (HSV-1) glycoprotein K (gK) exacerbated corneal scarring (CS) in ocularly infected mice. In this study, we investigated whether higher levels of CS were correlated with higher levels of latency and T cell exhaustion in gK-immunized mice. BALB/c mice were vaccinated with baculovirus-expressed gK or gD or mock immunized. Twenty-one days after the third immunization, mice were ocularly infected with 2 × 10(4) PFU/eye of virulent HSV-1 strain McKrae. On day 5 postinfection, virus replication in the eye was measured, and on day 30 postinfection, infiltration of the trigeminal ganglia (TG) by CD4, CD8, programmed death 1 (PD-1), and T cell immunoglobulin and mucin domain-containing protein 3 (Tim-3) was monitored by immunohistochemistry and quantitative real-time PCR (qRT-PCR). This study demonstrated that higher levels of CS were correlated with higher levels of latency, and this was associated with the presence of significantly higher numbers of CD4(+)PD-1(+) and CD8(+)PD-1(+) cells in the TG of the gK-immunized group than in both the gD- and mock-immunized groups. Levels of exhaustion associated with Tim-3 were the same among gK- and mock-vaccinated groups but higher than levels in the gD-vaccinated group. In this study, we have shown for the first time that both PD-1 and Tim-3 contribute to T cell exhaustion and an increase of latency in the TG of latently infected mice.


Figures

FIG. 1.
FIG. 1.
HSV-1 latency is increased in gK-immunized mice. BALB/c mice were immunized three times at 3-week intervals s.c. with baculovirus-expressed recombinant gK or gD or mock vaccinated with empty vector. Mice were infected with 2 × 10⁴ PFU of strain McKrae 3 weeks after final immunization. Thirty days p.i., mice were sacrificed, TG were removed, and total RNA and DNA were harvested. Quantitative RT-PCR and PCR were performed for the presence of LAT RNA and gB DNA, respectively. In each experiment, an estimated relative copy number of LAT and gB was calculated using standard curves generated from pGem-5317 and pAC-gB, respectively. Briefly, the DNA template was serially diluted 10-fold such that 5 μl contained 103 to 1011 copies of LAT or gB and then subjected to TaqMan PCR with the same set of primers. By comparing the normalized threshold cycle of each sample to the threshold cycle of the standard, the copy number for each reaction was determined. GAPDH expression was used to normalize the relative expression of LAT and gB in the TG. (A) LAT; (B) gB. Bars, means ± standard errors of the means (SEM) from 20 TG per group.
FIG. 2.
FIG. 2.
gD immunization reduces HSV-1 viral titer by day 5 p.i. BALB/c mice were immunized and infected as described in the legend to Fig. 1. Tear swabs were taken on days 1, 3, and 5 postinfection, and standard plaque assay was performed on RS cells to determine virus titer (PFU/milliliter). Bars, means ± SEM from three independent titration experiments for 20 mice per group (n = 40 eyes).
FIG. 3.
FIG. 3.
Effect of the higher levels of latency and CS on T cells and exhaustion markers in gK-immunized mice. BALB/c mice immunized and infected as described in the legend to Fig. 1 were allowed to progress to day 30 p.i. At this time, mice were sacrificed, TG were removed, total RNA was harvested, and gene expression was measured using TaqMan qRT-PCR. Expression is represented as a fold increase or decrease normalized to naive BALB/c expression. GAPDH expression was used to normalize the relative expression of each transcript. Bars, means ± SEM from 20 TG.
FIG. 4.
FIG. 4.
T cell exhaustion markers, PD-1 and Tim-3, colocalize to T cells in the TG of immunized mice during latency. BALB/c mice were immunized and infected as described in the legend to Fig. 1. On day 30 p.i., mice were sacrificed, TG were removed, and 15-μm sections were processed for the presence of CD4+Tim-3+, CD8+Tim-3+, CD4+PD-1+, and CD8+PD-1+ cells from 10 TG per group. (A) Tim-3-Alexa-647 (red), CD4-fluorescein isothiocyanate (FITC) (green); (B) Tim-3-Alexa-647 (red), CD8-FITC (green); (C) PD-1-tetramethyl rhodamine isothiocyanate (TriTc) (yellow), CD4-Alexa-647 (red); and (D) PD-1-TriTc (yellow), CD8-Alexa-647 (red) (20× direct magnification); (E) CD8-Alexa-647 (red), Tim-3-Alexa-488 (green), PD-1-Biotin-594 (white) (63× direct magnification). The nuclear stain DAPI (blue) is included in all panels. Arrows indicate positive stain and asterisks indicate the cell selected for inlay (63× magnification).
FIG. 4.
FIG. 4.
T cell exhaustion markers, PD-1 and Tim-3, colocalize to T cells in the TG of immunized mice during latency. BALB/c mice were immunized and infected as described in the legend to Fig. 1. On day 30 p.i., mice were sacrificed, TG were removed, and 15-μm sections were processed for the presence of CD4+Tim-3+, CD8+Tim-3+, CD4+PD-1+, and CD8+PD-1+ cells from 10 TG per group. (A) Tim-3-Alexa-647 (red), CD4-fluorescein isothiocyanate (FITC) (green); (B) Tim-3-Alexa-647 (red), CD8-FITC (green); (C) PD-1-tetramethyl rhodamine isothiocyanate (TriTc) (yellow), CD4-Alexa-647 (red); and (D) PD-1-TriTc (yellow), CD8-Alexa-647 (red) (20× direct magnification); (E) CD8-Alexa-647 (red), Tim-3-Alexa-488 (green), PD-1-Biotin-594 (white) (63× direct magnification). The nuclear stain DAPI (blue) is included in all panels. Arrows indicate positive stain and asterisks indicate the cell selected for inlay (63× magnification).
FIG. 5.
FIG. 5.
Upregulation of exhaustion markers on T cells in the TG of immunized mice. TG from BALB/c mice were processed as described in the legend to Fig. 4. More than 30 sections from 10 TG were stained and counted in a double-blind fashion for the presence of T cell markers (CD4 or CD8) and for the number of T cells positive for the exhaustion markers (PD-1 or Tim-3). (A) Quantification of CD4+, CD4+PD-1+, and CD4+Tim-3+ T cells; (B) quantification of CD8+, CD8+PD-1+, and CD8+Tim-3+ T cells. Bars, means ± SEM from 30 independent, double-blind sections from 10 TG per group.

References

    1. Albareda, M. C., G. C. Olivera, S. A. Laucella, M. G. Alvarez, E. R. Fernandez, B. Lococo, R. Viotti, R. L. Tarleton, and M. Postan. 2009. Chronic human infection with Trypanosoma cruzi drives CD4+ T cells to immune senescence. J. Immunol. 183:4103-4108. - PMC - PubMed
    1. Allen, S. J., K. R. Mott, A. V. Ljubimov, and H. Ghiasi. 2010. Exacerbation of corneal scarring in HSV-1 gK-immunized mice correlates with elevation of CD8+CD25+ T cells in corneas of ocularly infected mice. Virology 399:11-22. - PMC - PubMed
    1. Barber, D. L., E. J. Wherry, D. Masopust, B. Zhu, J. P. Allison, A. H. Sharpe, G. J. Freeman, and R. Ahmed. 2006. Restoring function in exhausted CD8 T cells during chronic viral infection. Nature 439:682-687. - PubMed
    1. Bond, V. C., and S. Person. 1984. Fine structure physical map locations of alterations that affect cell fusion in herpes simplex virus type 1. Virology 132:368-376. - PubMed
    1. Reference deleted.

Publication types

MeSH terms