. 2010 Nov 15;21(22):4028-41.
doi: 10.1091/mbc.E10-04-0348. Epub 2010 Sep 22.

Heparan sulfate acts as a bone morphogenetic protein coreceptor by facilitating ligand-induced receptor hetero-oligomerization

Affiliations

Heparan sulfate acts as a bone morphogenetic protein coreceptor by facilitating ligand-induced receptor hetero-oligomerization

Wan-Jong Kuo et al. Mol Biol Cell. .

Abstract

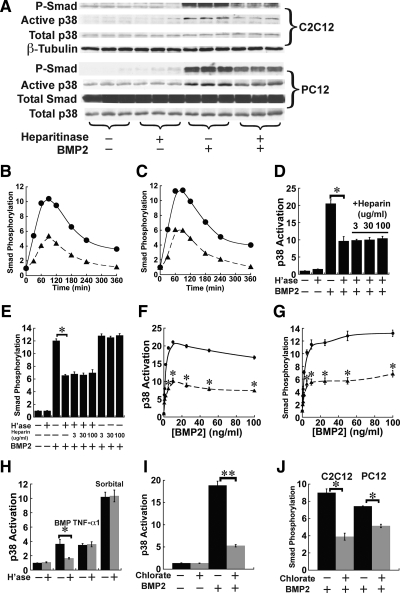
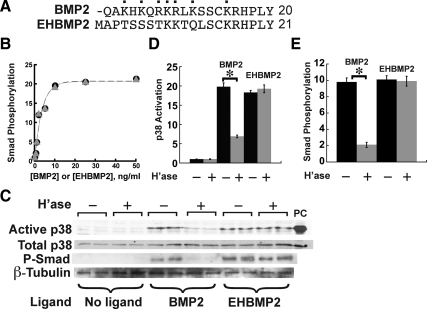
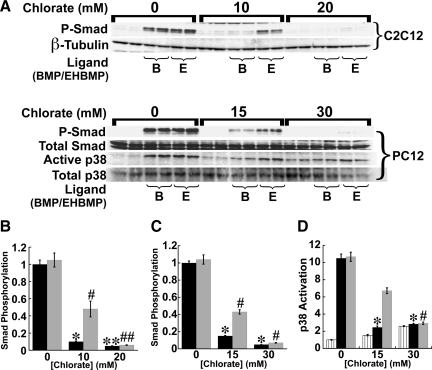
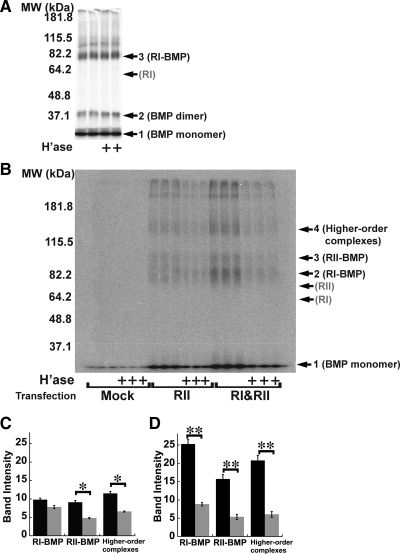
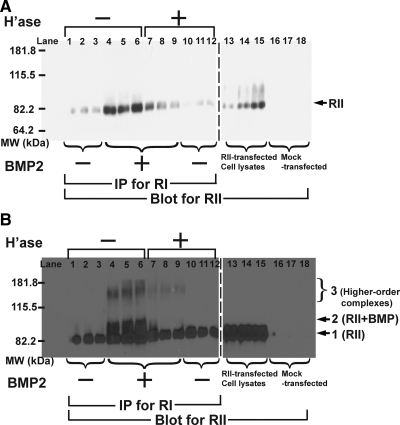
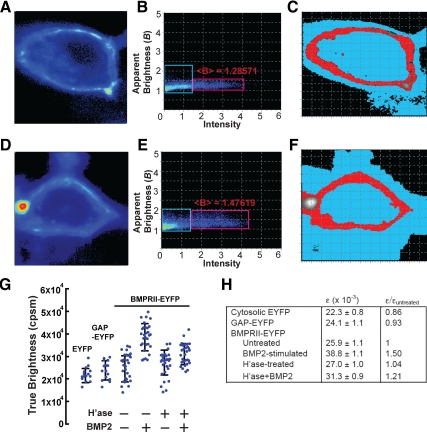
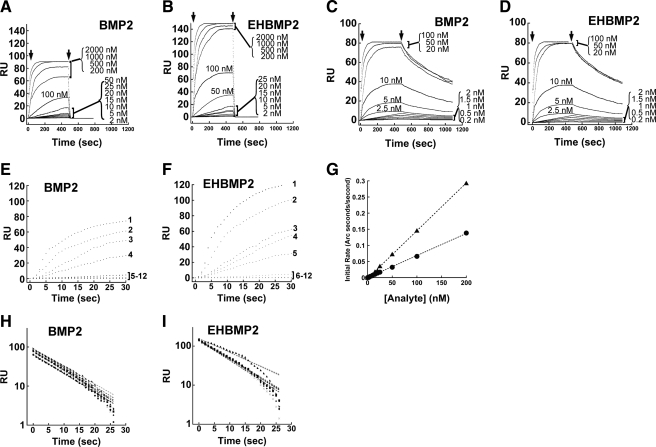
Cell surface heparan sulfate (HS) not only binds several major classes of growth factors but also sometimes potentiates their activities--an effect usually termed "coreception." A view that coreception is due to the stabilization of growth factor-receptor interactions has emerged primarily from studies of the fibroblast growth factors (FGFs). Recent in vivo studies have strongly suggested that HS also plays an important role in regulating signaling by the bone morphogenetic proteins (BMPs). Here, we provide evidence that the mechanism of coreception for BMPs is markedly different from that established for FGFs. First, we demonstrate a direct, stimulatory role for cell surface HS in the immediate signaling activities of BMP2 and BMP4, and we provide evidence that HS-BMP interactions are required for this effect. Next, using several independent assays of ligand binding and receptor assembly, including coimmunoprecipitation, cross-linking, and fluorescence fluctuation microscopy, we show that HS does not affect BMP binding to type I receptor subunits but instead enhances the subsequent recruitment of type II receptor subunits to BMP-type I receptor complexes. This suggests a view of HS as a catalyst of the formation of signaling complexes, rather than as a stabilizer of growth factor binding.


Figures

Figure 1.
Figure 1.
Heparitinase treatment and blockade of sulfation diminish responses of cultured cells to BMP2. (A) Smad phosphorylation and p38MAPK activation in mouse C2C12 and rat PC12 cells. Cells maintained in serum-free medium were treated with human recombinant BMP2 at 5 ng/ml for 1 h. Where indicated, cultures also were treated with 25 mIU/ml heparitinase 1 h before BMP addition and throughout the remainder of the assay. Cells lysates were subjected to immunoblotting for phospho-Smad1/5/8 (P-Smad) and active p38. Total Smad, total p38, and β-tubulin served as loading controls. (B and C) Kinetic profiles of BMP-induced Smad phosphorylation. C2C12 (B) or PC12 cells (C) were treated with heparitinase for 1 h, and BMP2 (5 ng/ml) was added. Cell lysates were collected at indicated time points and subjected to immunoblotting for P-Smad. Data are normalized to loading controls. (D and E) Exogenous heparin does not rescue cells from the effect of heparitinase treatment. C2C12 cells were treated with heparitinase for 1 h, and BMP2 (5 ng/ml), or BMP2 and heparin (3–100 μg/ml) were added for a subsequent hour. Cell lysates were subjected to immunoblotting for active p38 (D) or P-Smad (E), and band intensities were quantified. Data are from duplicate cultures for each condition and are normalized to loading controls. Both activation of p38 and Smad in response to BMP2 were substantially lower in heparitinase-treated cells than in untreated cells (*p < 0.01; t test) and were not improved by addition of exogenous heparin. Heparin alone did not affect BMP2-induced Smad phosphorylation. (F and G) Dose–response curves for p38 activation (F) or Smad phosphorylation (G) in C2C12 cells (circles) and C2C12 cells treated with heparitinase (triangles). Cells were stimulated with various concentrations of BMP2 for 1 h, lysed, and subjected to immunoblotting for active p38 or P-Smad. The p38 responses were reduced by about the same degree at every BMP2 concentration (asterisks denote points that are statistically significant, with p < 0.01; t test). Data are duplicates ± SD (error bars). (H) Heparitinase does not itself block p38 activation. C2C12 cells were treated with heparitinase for 1 h, and BMP2 (5 ng/ml; 1 h), TNF-α1 (0.2 ng/ml; 1 h) or sorbitol (250 mM; 30 min) were added before sample preparation. Cell lysates were subjected to immunoblotting for active p38. Only p38 activation by BMP2 was affected by heparitinase treatment (*p < 0.01; t test). Data are from triplicate cultures ± SD (error bars) for each condition, and are normalized to loading controls. (I) Blockade of sulfation diminishes BMP2-induced p38 activation. C2C12 cells were incubated with chlorate (10 mM) for 48 h, and BMP2 was added at 5 ng/ml for 1 h. Cell lysates were subjected to immunoblotting for active p38. Data are from triplicate cultures ± SD (error bars) for each condition, and band intensities are normalized to loading controls. The reduction in BMP2-induced p38 activation in chlorate-pretreated cells is statistically significant (**p < 0.001; t test). (J) BMP2-induced Smad phosphorylation is decreased in chlorate-pretreated C2C12 and PC12 cells. Cells were treated and samples prepared as in I, and subjected to immunoblotting for P-Smad. Data are from triplicate cultures ± SD (error bars) for each condition; band intensities are normalized to loading controls. In both cell types, the reduction of BMP2-induced Smad phosphorylation in chlorate-pretreated cells is statistically significant (*p < 0.01; t test).
Figure 2.
Figure 2.
A non-heparin binding BMP2 variant is resistant to heparitinase treatment. (A) Comparison of the N-terminal sequences of BMP2 and the engineered variant EH-BMP2, in which the first 12 amino acids have been replaced (Ruppert et al., 1996). Cationic residues in BMP2 are labeled with dots. (B) BMP2 and EHBMP2 are equal in potency. C2C12 cells were stimulated for 1 h with either BMP2 (circles) or EHBMP2 (triangles) at the indicated concentrations, lysed and subjected to immunoblotting for P-Smad. (C–E) Effect of heparitinase on p38 activation and Smad phosphorylation in BMP2- or EHBMP2-stimulated C2C12 cells. Cells were treated with heparitinase for 1 h and stimulated with either BMP2 or EHBMP2 for 1 h before sample preparation. Cell lysates were subjected to immunoblotting (panel C) for active p38 or P-Smad, with total p38 and β-tubulin serving as loading controls, and osmotic shock (sorbitol; 250 mM) as a positive control for active p38 (lane labeled “PC”). Band intensities were quantified and normalized to loading controls. In D and E, these data are plotted as mean values ± SD for each of the duplicate determinations shown in C. Significant effects of heparitinase on p38 activation and Smad phosphorylation are seen for BMP2-treated cells (*p < 0.01; t test) but not EHBMP2-treated cells.
Figure 3.
Figure 3.
A non-heparin binding BMP2 variant is partially resistant to chlorate treatment. (A) Smad phosphorylation and p38 activation were assessed by immunoblotting in C2C12 and PC12 cells pretreated with various concentrations of chlorate (as indicated) for 48 h, and stimulated with either BMP2 (labeled B) or EHBMP2 (labeled E), at 5 ng/ml for 1 h. Total Smad, total p38 and β-tubulin served as loading controls. The data (mean values normalized to loading controls ± SD) are quantified in panels B (P-Smad in C2C12 cells), C (P-Smad in PC12 cells) and D (active p38 in PC12 cells). Effects of heparitinase were statistically significant for both BMP2 (black bars) and EHBMP2 (gray bars), but weaker for EHBMP2, particularly when cells were treated with intermediate chlorate levels (*, #p < 0.01; **, ##p < 0.001; t test). In D, striped bars show basal (unstimulated) p38 activation, which is significantly elevated by high-dose chlorate exposure.
Figure 4.
Figure 4.
BMP binding to type II, but not type I, receptor subunits depends on HS. (A) Binding of 125I-BMP4 to BMPRIA. C2C12 cells were transiently transfected with HA-tagged BMPRIA, treated with heparitinase (1 h at 37°C), incubated with 125I-BMP4 (20 ng/ml, 2 h at room temperature), and cross-linked with BS3. Lysates were immunoprecipitated with anti-HA antibodies, and precipitates subjected to SDS-PAGE and autoradiography. Locations of molecular sizes corresponding to BMP monomer (18 kDa; arrow 1), cross-linked BMP dimer (36 kDa, arrow 2), and cross-linked BMPRIA-BMP complexes (78 kDa; arrow 3) are shown. An arrow marked RI shows the location of uncrosslinked HA-tagged BMPRIA (60 kDa; as determined separately by immunoblotting). (B) Binding of 125I-BMP4 to BMPRII. C2C12 cells were transfected stably with myc-tagged BMPRII (lanes labeled RII), or stably with BMPRII-myc and transiently with BMPRIA-HA (lanes labeled RI&RII). Mock-transfected cells were transiently transfected with vector (pcDNA3.1) only. 125I-BMP4 binding was carried out as in A. Lysates were immunoprecipitated with anti-myc antibodies, and precipitates subjected to SDS-PAGE and autoradiography. Locations of molecular sizes corresponding to BMP monomer (18 kDa; arrow 1), cross-linked BMPRIA-BMP complexes (78 kDa, arrow 2), cross-linked BMPRII-BMP complexes (93 kDa, arrow 3), and higher order complexes (∼153 kDa, arrow 4) are shown. Arrows RI and RII mark the locations of uncrosslinked BMPRIA-HA receptor (60 kDa) and uncrosslinked BMPRII-myc (75 kDa), as determined separately by immunoblotting. (C and D) Quantification of B. Results from cells transfected with BMPRII alone are shown in C, whereas those from cells transfected with both BMPRII and BMPRIA are in D (data are mean values ± SD of band intensities). Black bars quantify binding to cells not treated with heparitinase, whereas gray bars quantify binding to heparitinase-treated cells. The categories RI-BMP, RII-BMP, and higher-order complexes refer to the intensities of bands at arrows 2, 3, and 4, respectively, in B. Statistical significance of heparitinase effects was calculated by t test (*p <0.01; **p < 0.001).
Figure 5.
Figure 5.
Assembly of heteromeric receptor complexes is HS-dependent. (A) C2C12 cells stably expressing BMPRII-myc were transiently transfected with BMPRIA-HA. After treatment with or without heparitinase for 1 h, BMP2 (10 ng/ml) was added for 2 h at room temperature and cross-linked for 30 min with BS3. Cell lysates were immunoprecipitated with anti-HA antibodies and precipitates were subjected to SDS-PAGE and immunoblotting with anti-myc antibodies. The arrow shows the location of BMPRII-myc (75 kDa), as readily visualized in the blot of total cell lysates. (B) Long exposure of the blot in panel A. Arrow 1 shows the location of BMPRII. Arrow 2 marks bands with molecular weight corresponding to cross-linked BMPRII-BMP complexes (93 kDa). Larger bands, consistent with complexes containing BMPRI and BMPRII are also indicated (bracket 3).
Figure 6.
Figure 6.
Direct visualization of BMP2-induced type II receptor dimerization on live cells. (A–F) PC12 cells stably transfected with EYFP-tagged BMPRII were visualized by confocal microscopy. A–C show data gathered from a stack of 200 confocal scans of a single cell not treated with BMP; panels D–F are from 200 confocal scans of a cell exposed to BMP (10 ng/ml) for 2 h. In A and D, pixels are color-coded by mean intensity. Panels B and E are scatter plots of apparent brightness (ratio of variance to mean intensity) versus mean intensity for each pixel in the images in A and D, respectively. The red boxes highlight high-intensity pixels, the locations of which are rendered in red in C and F, respectively, whereas the blue boxes highlight low-intensity pixels, which are rendered in blue in panels C and F (the rendering shows that, as expected, most high-intensity pixels are located at the plasma membrane). Also shown in B and E is the median apparent brightness (<B>) of the high-intensity pixels, from which true molecular brightness (ε) can be calculated. (G) Effect of BMP2 and heparitinase on the true molecular brightness of BMPRII-EYFP. Cells expressing BMPRII-EYFP were treated with or without 25 mIU/ml heparitinase at 37°C for 1 h and then cultured in the presence or absence of BMP2 (10 ng/ml for 2 h), as indicated, and imaged as in A–F. Cells expressing cytosolic EYFP (“EYFP”) or EYFP fused to the membrane anchorage sequence of GAP43 (“GAP-EYFP”) served as controls. Individual ε values (in units of photon counts/s/molecule, or cpsm) are shown for each of 30 BMPRII-EYFP cells in each condition, as well as for 15 EYFP and 15 GAP-EYFP–expressing cells. Error bars show the standard deviations for every condition. (H) Mean ± SEM of the ε-values for each condition in G. Because ε-values are a direct reflection of molecular aggregation, the data imply that BMP2 elicits a 50% increase in the aggregation of BMPRII-EYFP (p < 0.05), but more than half of this increase is abolished by heparitinase treatment (p < 0.05). Heparitinase treatment alone had no significant effect (significance measures were by t test with Bonferroni correction).
Figure 7.
Figure 7.
Kinetic analysis of BMP2 and EHBMP2 binding to BMP receptors. (A and B) Representative sensorgrams of binding to BMPRII ectodomains. BMP2 (A) or EHBMP2 (B) was injected over the protein A-immobilized BMPRII-Fc (500 RUs)-coated sensor chip and over a control surface at various concentrations (2–2000 nM) at a flow rate of 50 μl/min. (C and D) Representative sensorgrams of BMP2 (C) or EHBMP2 (D) binding to BMPRIA ectodomains. BMP2 or EHBMP2 was injected over protein A-immobilized, BMPRIA-Fc (500 RUs)-coated sensor chip and over a control surface at various concentrations (0.2–100 nM) at a flow rate of 50 μl/min. Arrowheads mark initiation and termination of the injections. (E and F) Overlays of the initial portion (30 s) of association data for the binding of BMP2 (E) and EHBMP2 (F) to immobilized BMPRII-Fc at a range of concentrations, as marked: 1, 2000 nM; 2, 1000 nM; 3, 500 nM; 4, 200 nM; 5, 100 nM; 6, 50 nM; 7, 25 nM; 8, 20 nM; 9, 15 nM; 10, 10 nM; 11, 5 nM; and 12, 2 nM. (G) Initial binding rates of BMP2 (circles) and EHBMP2 (triangles) versus concentration. The slopes of these plots reveal the association rate constants (kon) of the two analytes, respectively. BMP2 binding to BMPRII-Fc yielded an apparent kon of 6.78 ± 0.29 × 10⁵ s−1 M−1, whereas EHBMP2 yielded a higher kon of 12.2 ± 2.46 × 10⁵ s−1 M−1. (H and I) Overlays of the dissociation phases of BMP2 (H) and EHBMP2 (I) from immobilized BMPRII-Fc at concentrations of 500-2000 nM, from two independent experiments. To calculate dissociation rate constants (koff), the data were fit to a single exponential decay curve. BMP2 and EHBMP2 yielded similar koff of 1.11 ± 0.01 × 10⁻¹ s−1 and 1.03 ± 0.16 × 10⁻¹ s−1, respectively. The equilibrium dissociation constants (KD) were therefore calculated to be 163.7 nM for BMP2, and 84.4 nM for EHBMP2 (Table 1). The actual data points are shown as symbols and the fitted curves as dotted lines.

Similar articles

Cited by

References

    1. Akiyama T., Kamimura K., Firkus C., Takeo S., Shimmi O., Nakato H. Dally regulates Dpp morphogen gradient formation by stabilizing Dpp on the cell surface. Dev. Biol. 2008;313:408–419. - PMC - PubMed
    1. Allendorph G. P., Vale W. W., Choe S. Structure of the ternary signaling complex of a TGF-beta superfamily member. Proc. Natl. Acad. Sci. USA. 2006;103:7643–7648. - PMC - PubMed
    1. Aviezer D., Yayon A. Heparin-dependent binding and autophosphorylation of epidermal growth factor (EGF) receptor by heparin-binding EGF-like growth factor but not by EGF. Proc. Natl. Acad. Sci. USA. 1994;91:12173–12177. - PMC - PubMed
    1. Baeuerle P. A., Huttner W. B. Chlorate–a potent inhibitor of protein sulfation in intact cells. Biochem. Biophys. Res. Commun. 1986;141:870–877. - PubMed
    1. Belenkaya T. Y., Han C., Yan D., Opoka R. J., Khodoun M., Liu H., Lin X. Drosophila Dpp morphogen movement is independent of dynamin-mediated endocytosis but regulated by the glypican members of heparan sulfate proteoglycans. Cell. 2004;119:231–244. - PubMed

Publication types

MeSH terms