. 2010 Sep 22;30(38):12856-67.
doi: 10.1523/JNEUROSCI.2700-10.2010.

The alpha2delta ligand gabapentin inhibits the Rab11-dependent recycling of the calcium channel subunit alpha2delta-2

Affiliations

The alpha2delta ligand gabapentin inhibits the Rab11-dependent recycling of the calcium channel subunit alpha2delta-2

Alexandra Tran-Van-Minh et al. J Neurosci. .

Abstract

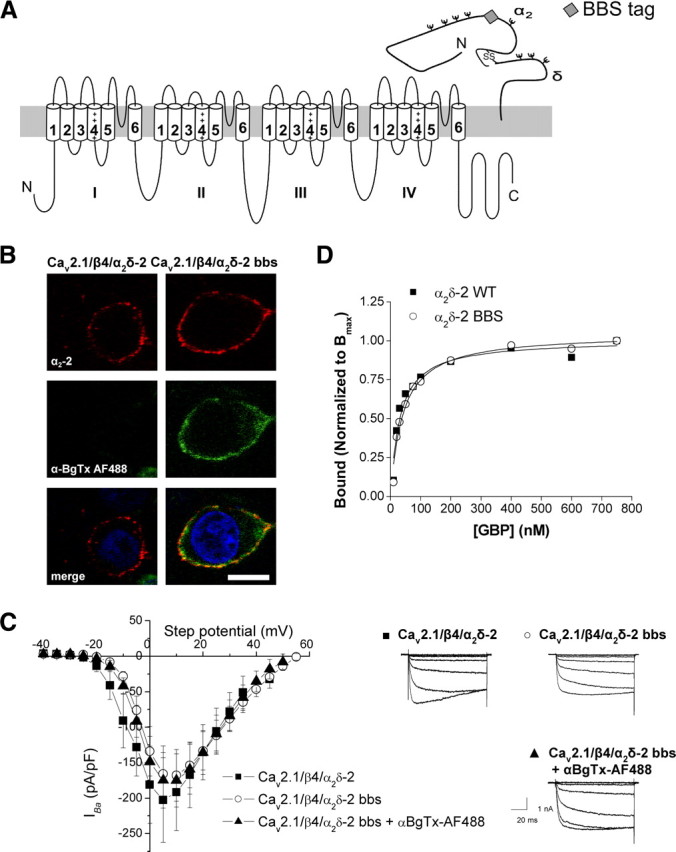
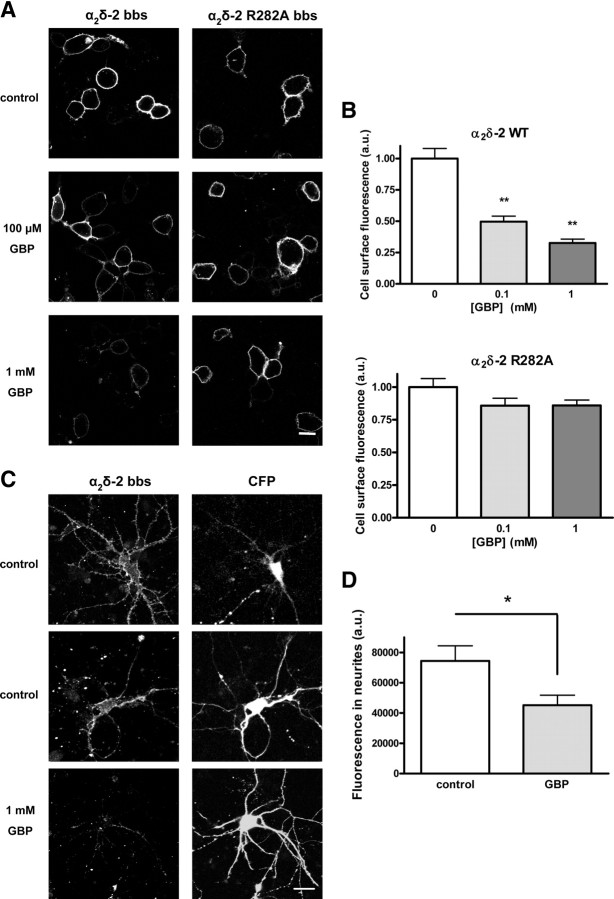
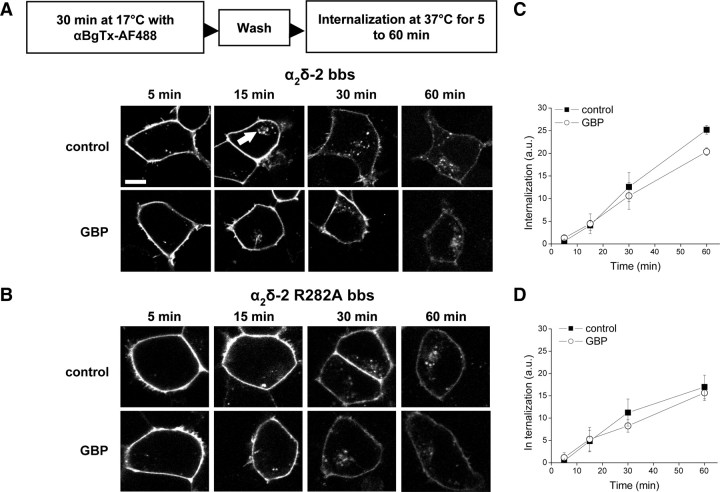
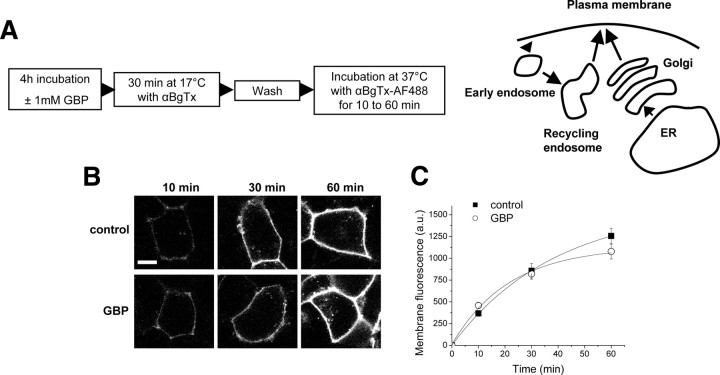
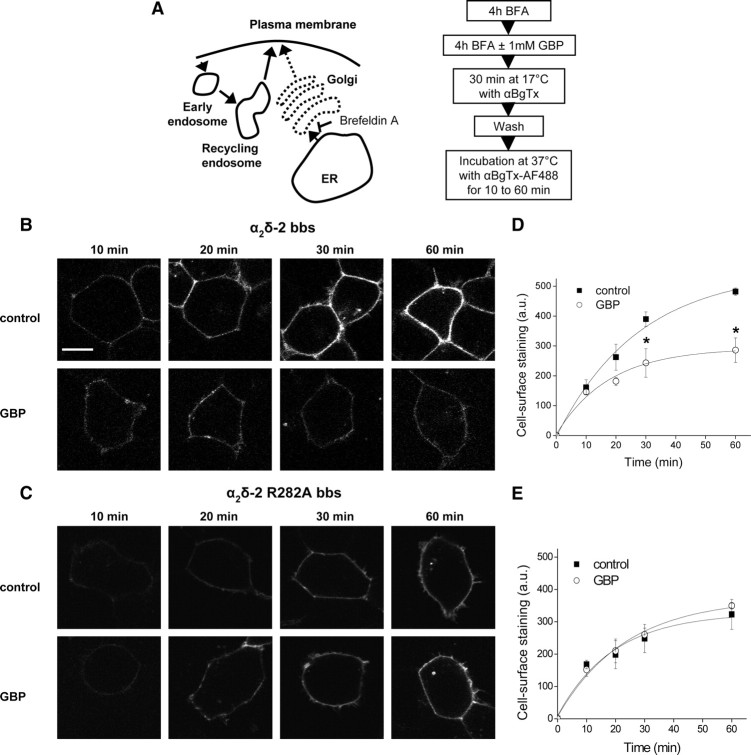
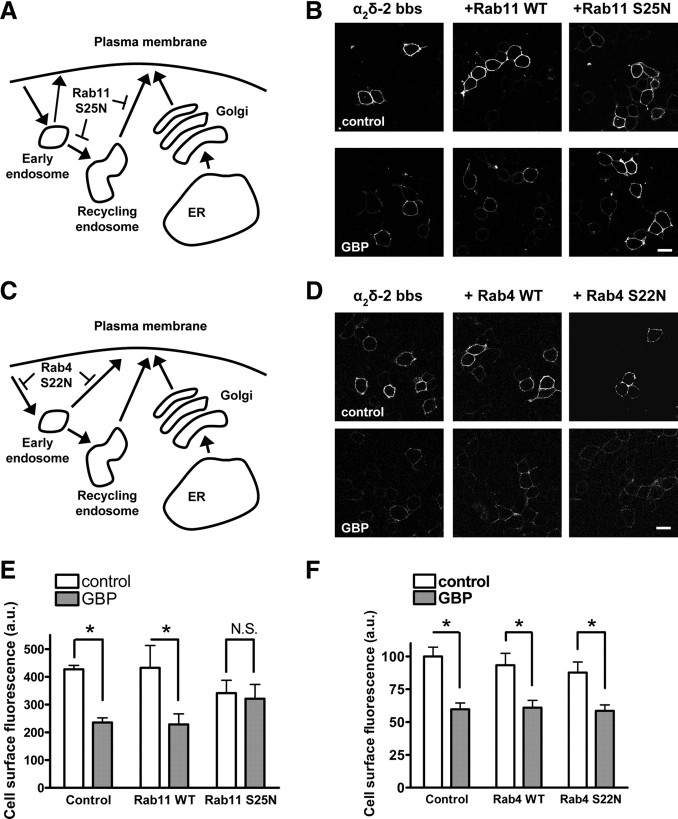
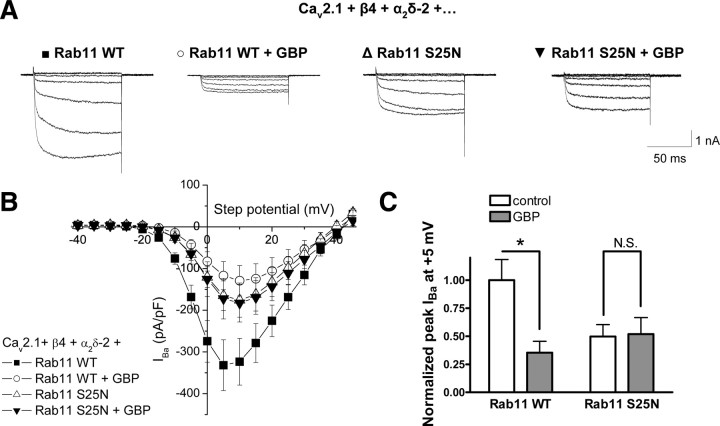
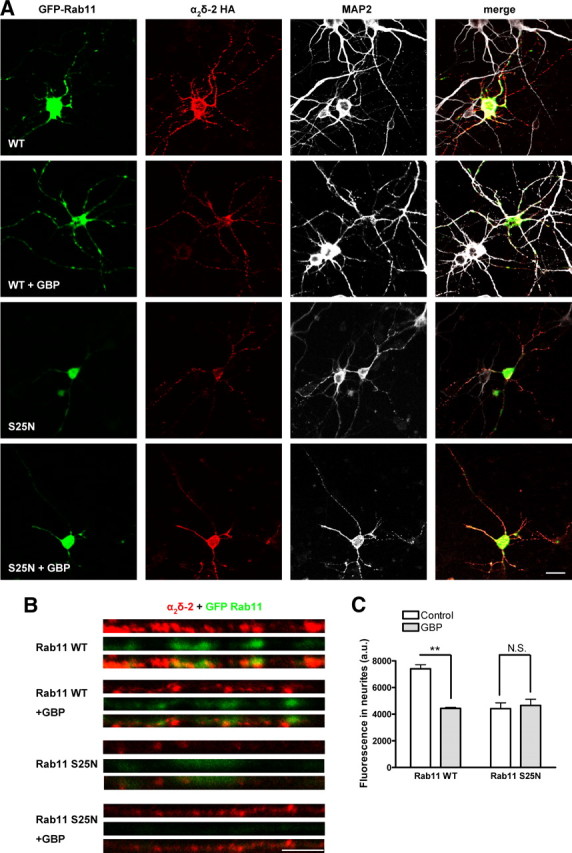
The α2δ subunits of voltage-gated calcium channels are important modulatory subunits that enhance calcium currents and may also have other roles in synaptogenesis. The antiepileptic and antiallodynic drug gabapentin (GBP) binds to the α2δ-1 and α2δ-2 isoforms of this protein, and its binding may disrupt the binding of an endogenous ligand, required for their correct function. We have shown previously that GBP produces a chronic inhibitory effect on calcium currents by causing a reduction in the total number of α2δ and α1 subunits at the cell surface. This action of GBP is likely to be attributable to a disruption of the trafficking of α2δ subunits, either to or from the plasma membrane. We studied the effect of GBP on the internalization of, and insertion into the plasma membrane of α2δ-2 using an α-bungarotoxin binding site-tagged α2δ-2 subunit, and a fluorescent derivative of α-bungarotoxin. We found that GBP specifically disrupts the insertion of α2δ-2 from post-Golgi compartments to the plasma membrane, and this effect was prevented by a mutation of α2δ-2 that abolishes its binding to GBP. The coexpression of the GDP-bound Rab11 S25N mutant prevented the GBP-induced decrease in α2δ-2 cell surface levels, both in cell lines and in primary neurons, and the GBP-induced reduction in calcium channel currents. In contrast, the internalization of α2δ-2 was unaffected by GBP. We conclude that GBP acts by preventing the recycling of α2δ-2 from Rab11-positive recycling endosomes to the plasma membrane.


Figures

Figure 1.
Figure 1.
Insertion of a bbs tag in the VGCC α2δ-2 subunit. A, Schematic representation of a Cav2.1 and a α2δ-2 subunit, showing the position of the bbs tag (gray diamond) in α2δ-2. B, tsA-201 cells were transfected with Cav2.1/α2δ-2/β4 or Cav2.1/α2δ-2 bbs/β4, and labeled with an antibody directed against α2-2 (102–117 peptide) (red fluorescence; top row) and with αBgTx-AF488 (green; middle row). The merged images also showing nuclear staining with DAPI are shown in the bottom row. The images are 1-μm-thick optical sections. Scale bar, 20 μm. C, I–V relationships (left) and representative currents traces resulting from step potentials from −90 mV to between −25 and +5 mV, in 5 mV increments (right) for cells transfected with Cav2.1/β4/α2δ-2 (■) (n = 7), or Cav2.1/β4/α2δ-2 bbs in the absence (○) (n = 10) or in the presence of αBgTx-AF488 (▴) (n = 8). Error bars indicate SEM. D, Binding isotherm for [3H]GBP to cholesterol-rich microdomains fractions prepared from tsA-201 cells expressing either α2δ-2 (■) (fitted to an hyperbola with KD = 28.5 nm; n = 3) or α2δ-2 bbs (○) (KD = 34.9 nm; n = 3). The binding curves were normalized to each mean Bmax.
Figure 2.
Figure 2.
Chronic GBP reduces the cell surface expression of α2δ-2 bbs. A, tsA-201 cells transfected with Cav2.1/β4/α2δ-2 bbs or Cav2.1/β4/α2δ-2 R282A bbs were incubated for 40 h with 100 μm or 1 mm GBP, or with addition of the equivalent volume of H2O (control cells). Plasma membrane-expressed α2δ-2 bbs was labeled at 17°C with αBgTx-AF488. Scale bar, 10 μm. B, Quantification of the fluorescence at the plasma membrane, measured within a region of interest covering an identical area across the plasma membrane of each cell present in the field of view, for WT α2δ-2 bbs or for α2δ-2 R282A bbs for control (white bars), 100 μm GBP (light gray bars), or 1 mm GBP (dark gray bars). The results are expressed as the mean ± SEM from three independent experiments (20–42 cells per condition per experiment). **p < 0.005, one way ANOVA and Bonferroni's post test. C, Primary cortical neurons expressing eCFP and α2δ-2 bbs were incubated for 72 h with 1 mm GBP or the equivalent volume of H2O (control cells). α2δ-2 bbs subunits were labeled using αBgTx-AF555, in the presence of 100 μm tubocurarine, to remove any background caused by the binding of αBgTx to α7 nicotinic receptors. All cells analyzed were positive for CFP expression. The panels corresponding to α2δ-2 bbs labeling correspond to a 1.2-μm-thick optical section, whereas the CFP panels show an average intensity projection of a z-stack containing three images. Scale bar, 20 μm. D, Quantification of αBgTx-AF555 labeling of neurites. The fluorescence density was measured in regions of interests corresponding to the neurites of individual neurons, in control condition (white bar) (n = 19) or after chronic incubation with GBP (gray bar) (n = 16). *p < 0.05, Student's unpaired t test.
Figure 3.
Figure 3.
GBP does not affect the internalization rate of α2δ-2 bbs. A, B, tsA-201 cells transfected with Cav2.1/β4/α2δ-2 bbs (A) or Cav2.1/β4/α2δ-2 R282A bbs (B) were incubated with αBgTx-AF488 at 17°C for 30 min, washed to remove free αBgTx-AF488, and then incubated at 37°C to allow internalization of the subunit, in the absence or in the presence of 1 mm GBP, and imaged at the indicated times (5–60 min), as summarized in the protocol above the images. Vesicles containing α2δ-2 bbs were seen intracellularly (indicated by the white arrow) after incubation at 37°C. Scale bar, 20 μm. C, D, Time course of the internalization of α2δ-2 bbs (C) or α2δ-2 R282A bbs (D), in the presence of 1 mm GBP (○) or control (■). The results are shown as the mean ± SEM of three independent experiments. In each experiment, 16–36 cells were analyzed per time point and condition.
Figure 4.
Figure 4.
The rate of insertion of α2δ-2 is not altered after 4 h in the presence of GBP. A, Diagram indicating the possible pathways (right) involved using the insertion assay (left). B, tsA-201 cells expressing Cav2.1/β4/α2δ-2 bbs were preincubated for 4 h without (control) or with 1 mm GBP. The cells were then incubated at 17°C with unlabeled αBgTx for 30 min, and then at 37°C with αBgTx-AF488 for the indicated times, as summarized in the protocol in A. Scale bar, 20 μm. C, Quantification of the fluorescence appearing at the plasma membrane over time, in the presence of 1 mm GBP (○) or control (■). The results are expressed as the mean ± SEM of three independent experiments. In each experiment, 14–36 cells were analyzed per time point and condition.
Figure 5.
Figure 5.
Effect of GBP on the forward trafficking of α2δ-2 subunits. A, Diagram (left) indicating the possible pathways involved using the assay described (right). B, C, tsA-201 cells expressing Cav2.1/β4/α2δ-2 bbs (B) or Cav2.1/β4/α2δ-2 R282A bbs (C) were incubated for 4 h with 50 ng/ml BFA. One millimolar GBP or the equivalent volume of H2O was subsequently added to the cells for 4 h. The cells were then incubated at 17°C with unlabeled αBgTx for 30 min, and then at 37°C with αBgTx-AF488 for the indicated times, as summarized in the protocol in A. Scale bar, 20 μm. The imaging settings were modified compared with Figure 4 to obtain a better visualization of the cells but were kept constant within the experiment. D, E, Time courses for the insertion of α2δ-2 bbs (D) or α2δ-2 R282A bbs (E) subunits at the plasma membrane, in the presence of 1 mm GBP (○) or control (■). The results are expressed as the mean ± SEM of three independent experiments. In each experiment, 14–41 cells were analyzed per time point and condition. *p < 0.05, two-way ANOVA and Bonferroni's post test. The data in D and E were fit with single exponentials, to estimate the rate of insertion under the different conditions. The time constant (τ) for the insertion of α2δ-2 bbs at the plasma membrane was 27.6 min under control conditions and 17.6 min in the presence of GBP (D). In contrast, the calculated τ for α2δ-2 R282A bbs insertion were similar in the absence (19.1 min) and in the presence (23.4 min) of GBP (E).
Figure 6.
Figure 6.
GBP inhibits the trafficking α2δ-2 through Rab11-associated endosomes. A, Diagram indicating the possible pathways involved using Rab11 S25N. B, Cells transfected with Cav2.1/β4/α2δ-2 bbs and either a control cDNA (empty vector), WT Rab11, or Rab11 S25N were incubated with 1 mm GBP for 40 h. The α2δ-2 subunits present at the plasma membrane were labeled with αBgTx-AF488 at 17°C. Scale bar, 20 μm. C, Diagram indicating the possible pathways involved using Rab4 S22N. D, Cells transfected with Cav2.1/β4/α2δ-2 bbs and either a control cDNA (empty vector), WT Rab4, or Rab4 S22N were incubated with 1 mm GBP for 40 h. The α2δ-2 subunits present at the plasma membrane were labeled with αBgTx-AF555 at 17°C. Scale bar, 20 μm. E, F, Quantification of the fluorescence at the plasma membrane in the absence (white bars) and in the presence of GBP (gray bars) for the three conditions, as indicated, in the presence of Rab11 (E) or Rab4 (F) constructs. Results are expressed as mean ± SEM of three independent experiments (23–65 cells per condition and per experiment). *p < 0.05, two-way ANOVA and Bonferroni's post test.
Figure 7.
Figure 7.
The Rab11 pathway is involved in the reduction of calcium currents by chronic GBP. A, Representative currents traces resulting from step potentials from −90 mV to between −25 mV and +5 mV, in 5 mV increments for cells transfected with Cav2.1/β4/α2δ-2/WT Rab11 in the absence (■) or the presence of chronic GBP (○), or Cav2.1/β4/α2δ-2/Rab11 S25N in the absence (▵) or in the presence of chronic GBP (▾). B, I–V relationships for cells transfected with Cav2.1/β4/α2δ-2/WT Rab11 under control conditions (■) (n = 13) or after chronic incubation with 1 mm GBP (○) (n = 10), or Cav2.1/β4/α2δ-2/Rab11 S25N in the absence (▵) (n = 13) or in the presence (▾) (n = 12) of chronic GBP. C, Mean peak IBa calculated at +5 mV and normalized to the value of the control condition, in the absence (white bars) and in the presence (gray bars) of GBP. *p < 0.05, two-way ANOVA and Bonferroni's post test.
Figure 8.
Figure 8.
Effect of GBP and Rab11 S25N on α2δ-2 expression in primary cortical neurons. A, Cortical neurons were cultured for 5–6 d, and then transfected with α2δ-2 HA and either GFP-Rab11 WT or GFP-Rab11 S25N, and incubated for 3 d in the absence or in the presence of 1 mm GBP for 72 h. Cell surface α2δ-2 was detected by live labeling using an antibody directed against the HA epitope (column 2) before fixation and permeabilization of the cells and immunodetection of GFP-Rab11 constructs using an antibody directed against GFP (column 1), and MAP2, detected using a Cy5-conjugated secondary antibody (column 3). A merged imaged is shown in column 4. GFP-Rab11 S25N displays a diffuse localization corresponding to its lack of association with cellular membranes. Scale bar, 20 μm. B, Enlarged images of straightened neurite segments, localized 200–300 μm from the cell body, stained for cell surface-expressed α2δ-2 (red) and for GFP-Rab11 (green). Scale bar, 5 μm. C, Quantification of the fluorescence density corresponding to the cell surface immunoreactivity for α2δ-2 in neurites segments, in the absence (white bars) or in the presence (gray bar) of 1 mm GBP. The results are expressed as the mean ± SEM of 11–22 cells from four independent experiments. **p < 0.001, two-way ANOVA and Bonferroni's post test.

Similar articles

Cited by

References

    1. Alden KJ, García J. Differential effect of gabapentin on neuronal and muscle calcium currents. J Pharmacol Exp Ther. 2001;297:727–735. - PubMed
    1. Arikkath J, Campbell KP. Auxiliary subunits: essential components of the voltage-gated calcium channel complex. Curr Opin Neurobiol. 2003;13:298–307. - PubMed
    1. Balse E, El-Haou S, Dillanian G, Dauphin A, Eldstrom J, Fedida D, Coulombe A, Hatem SN. Cholesterol modulates the recruitment of Kv1.5 channels from Rab11-associated recycling endosome in native atrial myocytes. Proc Natl Acad Sci U S A. 2009;106:14681–14686. - PMC - PubMed
    1. Barclay J, Balaguero N, Mione M, Ackerman SL, Letts VA, Brodbeck J, Canti C, Meir A, Page KM, Kusumi K, Perez-Reyes E, Lander ES, Frankel WN, Gardiner RM, Dolphin AC, Rees M. Ducky mouse phenotype of epilepsy and ataxia is associated with mutations in the Cacna2d2 gene and decreased calcium channel current in cerebellar Purkinje cells. J Neurosci. 2001;21:6095–6104. - PMC - PubMed
    1. Bauer CS, Nieto-Rostro M, Rahman W, Tran-Van-Minh A, Ferron L, Douglas L, Kadurin I, Sri Ranjan Y, Fernandez-Alacid L, Millar NS, Dickenson AH, Lujan R, Dolphin AC. The increased trafficking of the calcium channel α2δ-1 to presynaptic terminals in neuropathic pain is inhibited by the α2δ ligand pregabalin. J Neurosci. 2009;29:4076–4088. - PMC - PubMed

Publication types