

Orientation selectivity of motion-boundary responses in human visual cortex
- PMID: 20861432
- PMCID: PMC3007646
- DOI: 10.1152/jn.00400.2010
Orientation selectivity of motion-boundary responses in human visual cortex
Abstract
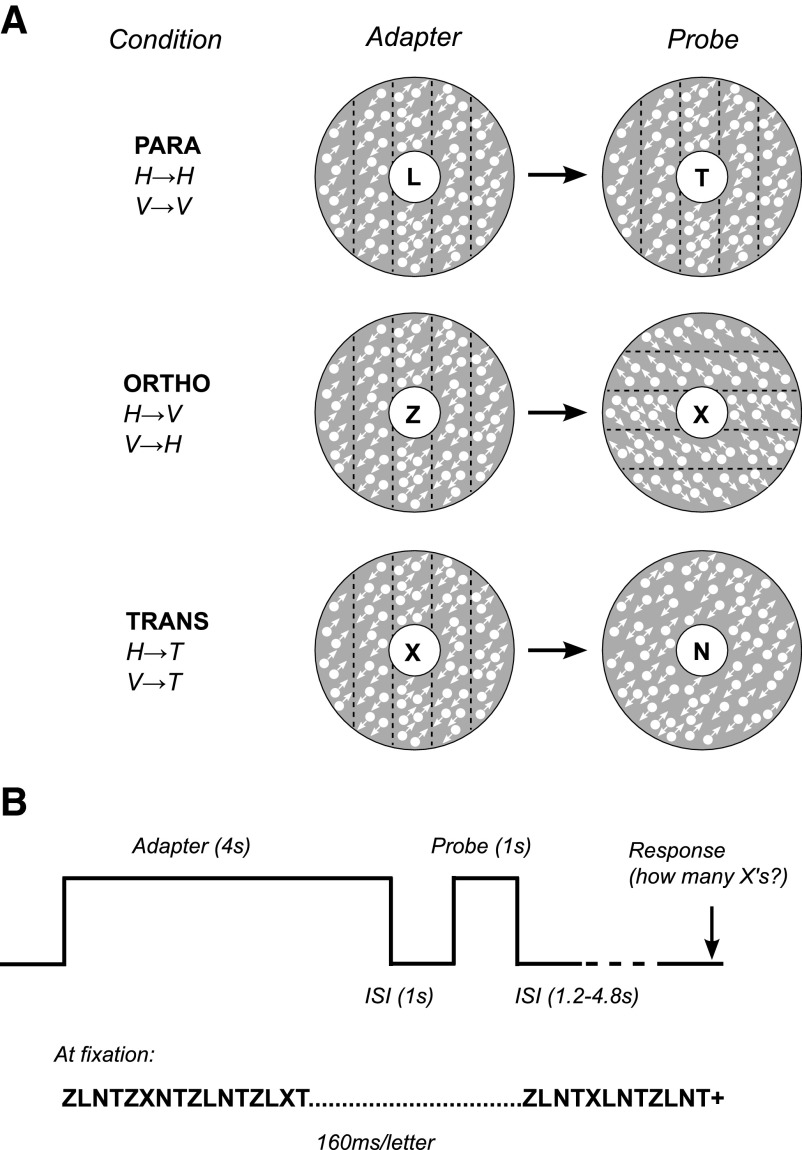
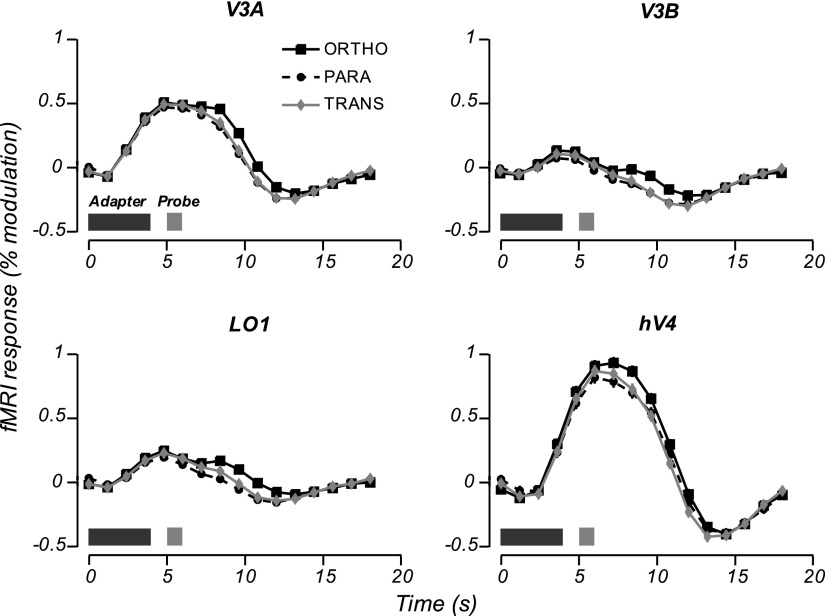
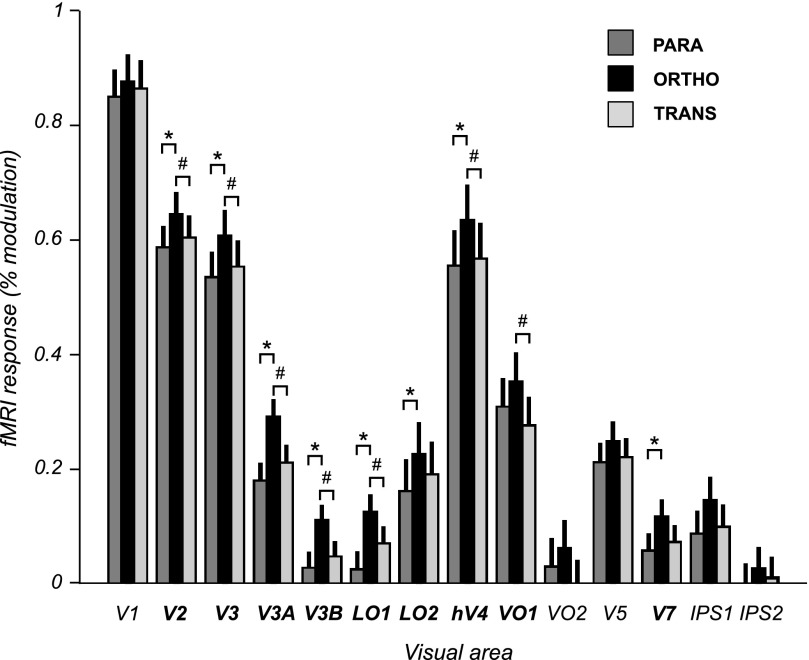
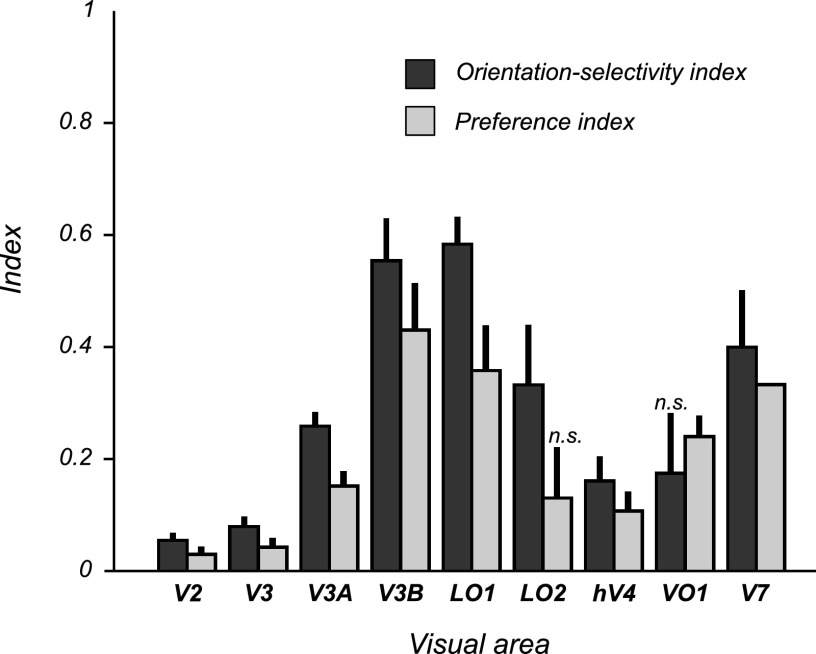
Motion boundaries (local changes in visual motion direction) arise naturally when objects move relative to an observer. In human visual cortex, neuroimaging studies have identified a region (the kinetic occipital area [KO]) that responds more strongly to motion-boundary stimuli than to transparent-motion stimuli. However, some functional magnetic resonance imaging (fMRI) studies suggest that KO may encompass multiple visual areas and single-unit studies in macaque visual cortex have identified neurons selective for motion-boundary orientation in areas V2, V3, and V4, implying that motion-boundary selectivity may not be restricted to a single area. It is not known whether fMRI responses to motion boundaries are selective for motion-boundary orientation, as would be expected if these responses reflected the population activity of motion-boundary-selective neurons. We used an event-related fMRI adaptation protocol to measure orientation-selective responses to motion boundaries in human visual cortex. On each trial, we measured the response to a probe stimulus presented after an adapter stimulus (a vertical or horizontal motion-boundary grating). The probe stimulus was either a motion-boundary grating oriented parallel or orthogonal to the adapter stimulus or a transparent-motion stimulus. Orientation-selective adaptation for motion boundaries--smaller responses for trials in which test and adapter stimuli were parallel to each other--was observed in multiple extrastriate visual areas. The strongest adaptation, relative to the unadapted responses, was found in V3A, V3B, LO1, LO2, and V7. Most of the visual areas that exhibited orientation-selective adaptation in our data also showed response preference for motion boundaries over transparent motion, indicating that most of the human visual areas previously shown to respond to motion boundaries are also selective for motion-boundary orientation. These results suggest that neurons selective for motion-boundary orientation are distributed across multiple human visual cortical areas and argue against the existence of a single region or area specialized for motion-boundary processing.
Figures
Similar articles
-
Orientation-selective adaptation to first- and second-order patterns in human visual cortex.J Neurophysiol. 2006 Feb;95(2):862-81. doi: 10.1152/jn.00668.2005. Epub 2005 Oct 12. J Neurophysiol. 2006. PMID: 16221748 Free PMC article. Clinical Trial.
-
Human cortical areas underlying the perception of optic flow: brain imaging studies.Int Rev Neurobiol. 2000;44:269-92. doi: 10.1016/s0074-7742(08)60746-1. Int Rev Neurobiol. 2000. PMID: 10605650 Review.
-
Orientation-selective adaptation to illusory contours in human visual cortex.J Neurosci. 2007 Feb 28;27(9):2186-95. doi: 10.1523/JNEUROSCI.4173-06.2007. J Neurosci. 2007. PMID: 17329415 Free PMC article.
-
Processing of kinetically defined boundaries in areas V1 and V2 of the macaque monkey.J Neurophysiol. 2000 Dec;84(6):2786-98. doi: 10.1152/jn.2000.84.6.2786. J Neurophysiol. 2000. PMID: 11110809
-
Higher order visual processing in macaque extrastriate cortex.Physiol Rev. 2008 Jan;88(1):59-89. doi: 10.1152/physrev.00008.2007. Physiol Rev. 2008. PMID: 18195083 Review.
Cited by
-
Neural correlates of induced motion perception in the human brain.J Neurosci. 2012 Oct 10;32(41):14344-54. doi: 10.1523/JNEUROSCI.0570-12.2012. J Neurosci. 2012. PMID: 23055505 Free PMC article. Clinical Trial.
-
Population receptive field estimates for motion-defined stimuli.Neuroimage. 2019 Oct 1;199:245-260. doi: 10.1016/j.neuroimage.2019.05.068. Epub 2019 May 31. Neuroimage. 2019. PMID: 31158480 Free PMC article.
-
Look but don't touch: Visual cues to surface structure drive somatosensory cortex.Neuroimage. 2016 Mar;128:353-361. doi: 10.1016/j.neuroimage.2015.12.054. Epub 2016 Jan 9. Neuroimage. 2016. PMID: 26778128 Free PMC article.
-
Motion direction biases and decoding in human visual cortex.J Neurosci. 2014 Sep 10;34(37):12601-15. doi: 10.1523/JNEUROSCI.1034-14.2014. J Neurosci. 2014. PMID: 25209297 Free PMC article.
-
Independent repetition suppression in macaque area V2 and inferotemporal cortex.J Neurophysiol. 2022 Dec 1;128(6):1421-1434. doi: 10.1152/jn.00043.2022. Epub 2022 Nov 9. J Neurophysiol. 2022. PMID: 36350050 Free PMC article.
References
-
- Benjamini Y, Hochberg Y. Controlling the false discovery rate: a practical and powerful approach to multiple testing. J R Stat Soc B 57: 289–300, 1995
-
- Brewer AA, Liu J, Wade AR, Wandell BA. Visual field maps and stimulus selectivity in human ventral occipital cortex. Nat Neurosci 8: 1102–1109, 2005 - PubMed
-
- Dupont P, De Bruyn B, Vandenberghe R, Rosier AM, Michiels J, Marchal G, Mortelmans L, Orban GA. The kinetic occipital region in human visual cortex. Cereb Cortex 7: 283–292, 1997 - PubMed
Publication types
MeSH terms
Grants and funding
LinkOut - more resources
Full Text Sources
Research Materials