

Validation of independent component analysis for rapid spike sorting of optical recording data
- PMID: 20861441
- PMCID: PMC3007652
- DOI: 10.1152/jn.00691.2010
Validation of independent component analysis for rapid spike sorting of optical recording data
Abstract
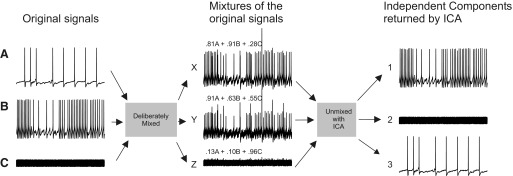
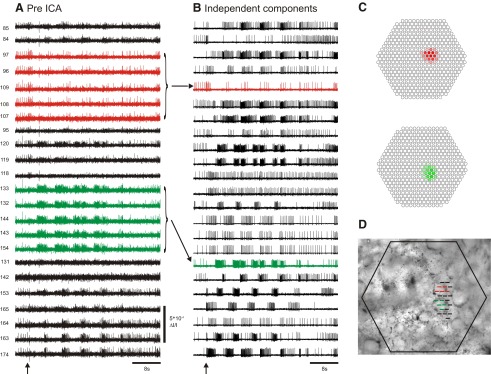
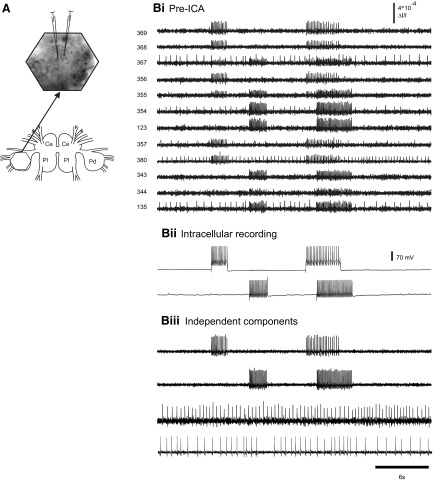
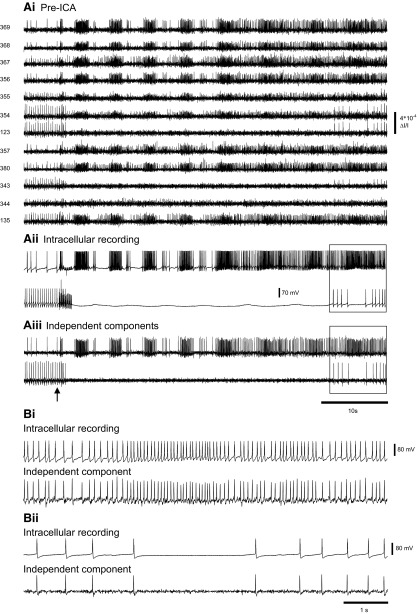
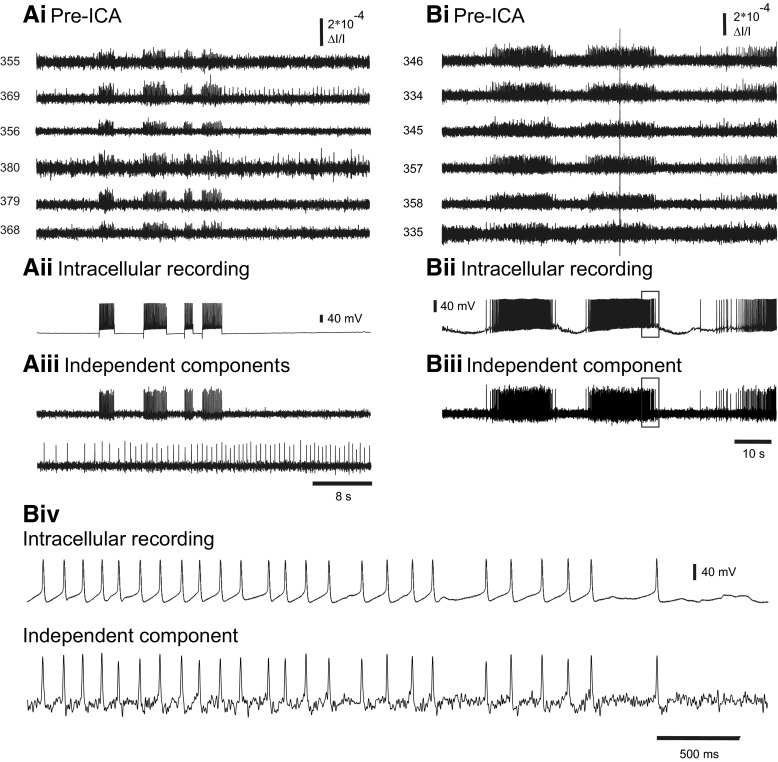
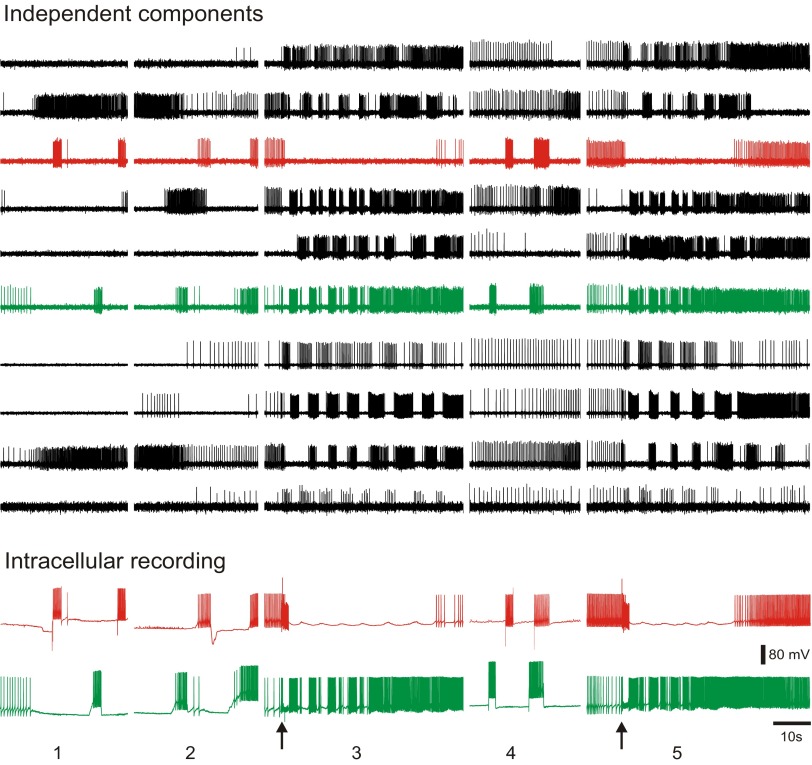
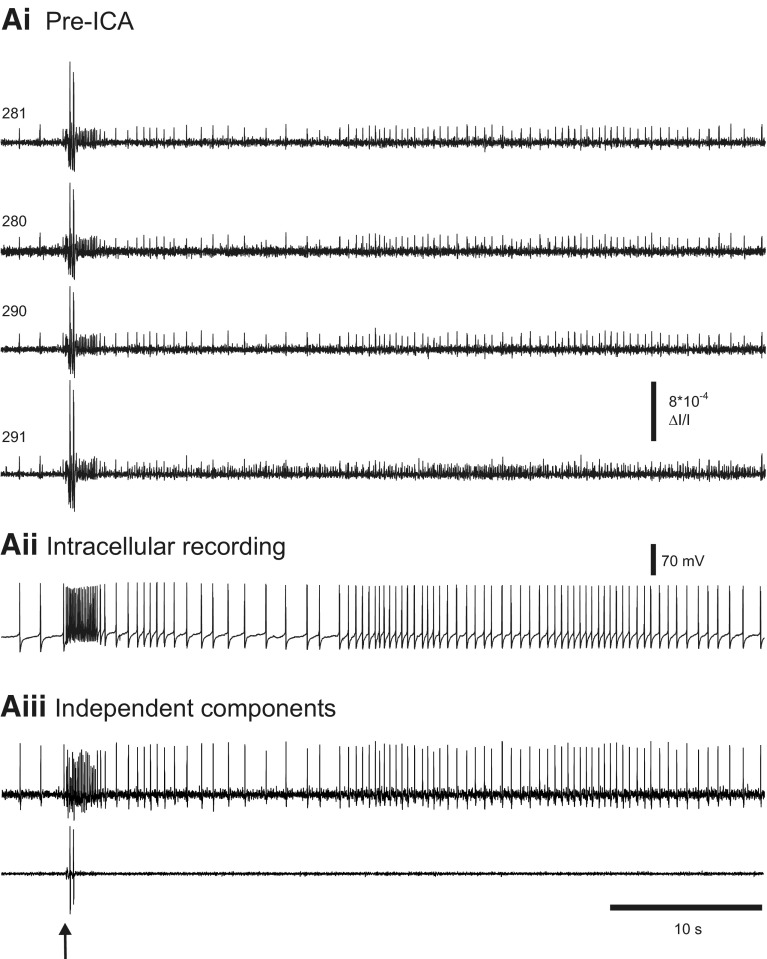
Independent component analysis (ICA) is a technique that can be used to extract the source signals from sets of signal mixtures where the sources themselves are unknown. The analysis of optical recordings of invertebrate neuronal networks with fast voltage-sensitive dyes could benefit greatly from ICA. These experiments can generate hundreds of voltage traces containing both redundant and mixed recordings of action potentials originating from unknown numbers of neurons. ICA can be used as a method for converting such complex data sets into single-neuron traces, but its accuracy for doing so has never been empirically evaluated. Here, we tested the accuracy of ICA for such blind source separation by simultaneously performing sharp electrode intracellular recording and fast voltage-sensitive dye imaging of neurons located in the central ganglia of Tritonia diomedea and Aplysia californica, using a 464-element photodiode array. After running ICA on the optical data sets, we found that in 34 of 34 cases the intracellularly recorded action potentials corresponded 100% to the spiking activity of one of the independent components returned by ICA. We also show that ICA can accurately sort action potentials into single neuron traces from a series of optical data files obtained at different times from the same preparation, allowing one to monitor the network participation of large numbers of individually identifiable neurons over several recording episodes. Our validation of the accuracy of ICA for extracting the neural activity of many individual neurons from noisy, mixed, and redundant optical recording data sets should enable the use of this powerful large-scale imaging approach for studies of invertebrate and suitable vertebrate neuronal networks.
Figures
Similar articles
-
Monitoring Spiking Activity of Many Individual Neurons in Invertebrate Ganglia.Adv Exp Med Biol. 2015;859:127-45. doi: 10.1007/978-3-319-17641-3_5. Adv Exp Med Biol. 2015. PMID: 26238051 Free PMC article. Review.
-
Fast optical measurement of membrane potential changes at multiple sites on an individual nerve cell.Histochem J. 1998 Mar;30(3):197-216. doi: 10.1023/a:1003299420524. Histochem J. 1998. PMID: 10188927
-
A stereo-compound hybrid microscope for combined intracellular and optical recording of invertebrate neural network activity.J Neurosci Methods. 2007 May 15;162(1-2):148-54. doi: 10.1016/j.jneumeth.2007.01.003. Epub 2007 Jan 13. J Neurosci Methods. 2007. PMID: 17306887 Free PMC article.
-
Applicability of independent component analysis on high-density microelectrode array recordings.J Neurophysiol. 2012 Jul;108(1):334-48. doi: 10.1152/jn.01106.2011. Epub 2012 Apr 4. J Neurophysiol. 2012. PMID: 22490552 Free PMC article.
-
In Vivo Observations of Rapid Scattered Light Changes Associated with Neurophysiological Activity.In: Frostig RD, editor. In Vivo Optical Imaging of Brain Function. 2nd edition. Boca Raton (FL): CRC Press/Taylor & Francis; 2009. Chapter 5. In: Frostig RD, editor. In Vivo Optical Imaging of Brain Function. 2nd edition. Boca Raton (FL): CRC Press/Taylor & Francis; 2009. Chapter 5. PMID: 26844322 Free Books & Documents. Review.
Cited by
-
Optical Spike Detection and Connectivity Analysis With a Far-Red Voltage-Sensitive Fluorophore Reveals Changes to Network Connectivity in Development and Disease.Front Neurosci. 2021 May 13;15:643859. doi: 10.3389/fnins.2021.643859. eCollection 2021. Front Neurosci. 2021. PMID: 34054405 Free PMC article.
-
Multifocal fluorescence microscope for fast optical recordings of neuronal action potentials.Biophys J. 2015 Feb 3;108(3):520-9. doi: 10.1016/j.bpj.2014.12.005. Biophys J. 2015. PMID: 25650920 Free PMC article.
-
Improving voltage-sensitive dye imaging: with a little help from computational approaches.Neurophotonics. 2017 Jul;4(3):031215. doi: 10.1117/1.NPh.4.3.031215. Epub 2017 May 19. Neurophotonics. 2017. PMID: 28573154 Free PMC article.
-
Motor neuronal activity varies least among individuals when it matters most for behavior.J Neurophysiol. 2015 Feb 1;113(3):981-1000. doi: 10.1152/jn.00729.2014. Epub 2014 Nov 19. J Neurophysiol. 2015. PMID: 25411463 Free PMC article.
-
Modular deconstruction reveals the dynamical and physical building blocks of a locomotion motor program.Neuron. 2015 Apr 8;86(1):304-18. doi: 10.1016/j.neuron.2015.03.005. Epub 2015 Mar 26. Neuron. 2015. PMID: 25819612 Free PMC article.
References
-
- Bell AJ, Sejnowski TJ. An information-maximization approach to blind separation and blind deconvolution. Neural Comput 7: 1129–1159, 1995 - PubMed
-
- Briggman KL, Abarbanel HD, Kristan WB., Jr Optical imaging of neuronal populations during decision-making. Science 307: 896–901, 2005 - PubMed
-
- Brown GD, Yamada S, Nakashima M, Moore-Kochlacs C, Sejnowski TJ, Shiono S. Independent component analysis of optical recordings from Tritonia swimming neurons. UCSD Technical Report INC-08-001. La Jolla, CA: Institute for Neural Computation, Univ. of California San Diego, October 2008
-
- Brown GD, Yamada S, Sejnowski TJ. Independent component analysis at the neural cocktail party. Trends Neurosci 24: 54–63, 2001 - PubMed
Publication types
MeSH terms
Substances
Grants and funding
LinkOut - more resources
Full Text Sources
Other Literature Sources
Miscellaneous