

Properties of connexin 46 hemichannels in dissociated lens fiber cells
- PMID: 20861491
- PMCID: PMC3053112
- DOI: 10.1167/iovs.10-6200
Properties of connexin 46 hemichannels in dissociated lens fiber cells
Abstract
Purpose: To characterize the properties of connexin 46 hemichannels in differentiating fiber cells isolated from mouse lenses.
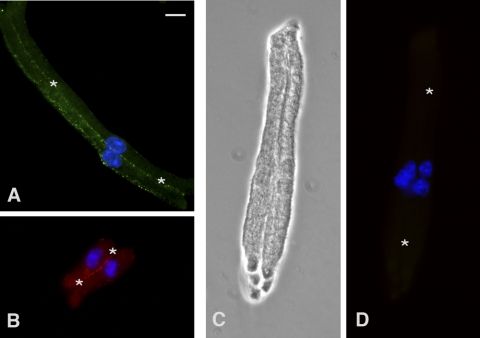
Methods: Differentiating fiber cells were isolated from mouse lenses using collagenase. Cellular localization of connexin 50 (Cx50) and connexin 46 (Cx46) was assessed by immunofluorescence. Membrane currents were recorded using whole cell patch clamping. Dye uptake was measured using time-lapse imaging.
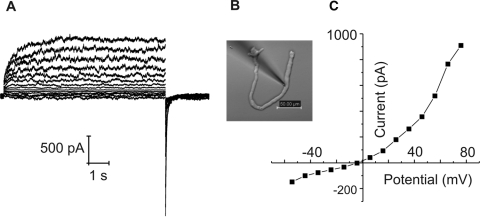
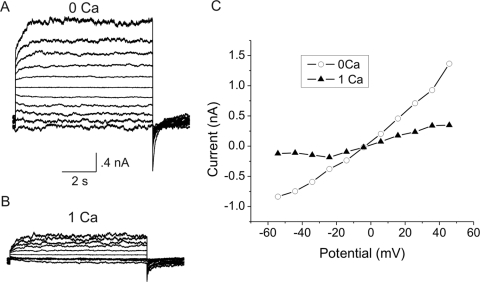
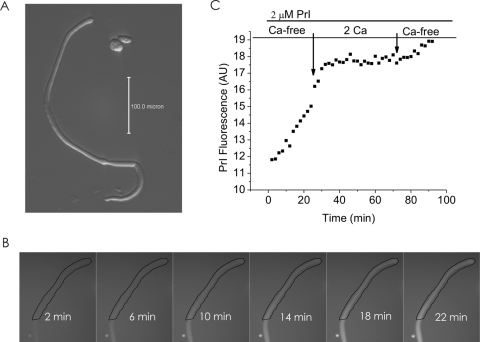
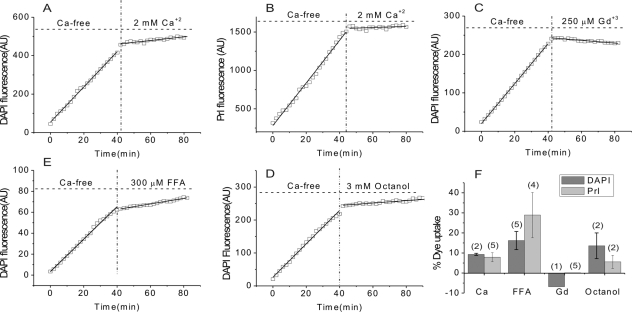
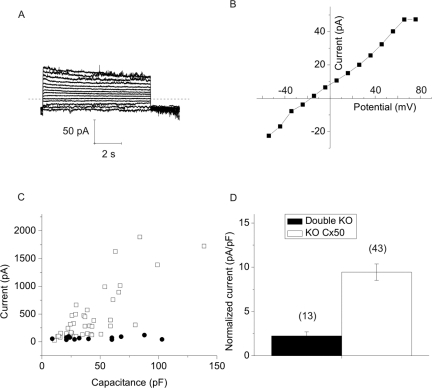
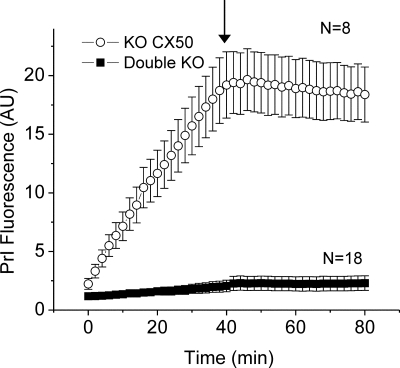
Results: In freshly dissociated fiber cells isolated from knockout Cx50 (KOCx50) mouse lenses, removal of external divalent cations induced a macroscopic current composed of large conductance channels. This current was reduced at a holding potential of -60 mV, activated on depolarization, and had a reversal potential near 0 mV. These properties were very similar to those of Cx46 hemichannel currents recorded in single Xenopus oocytes. If the currents observed in divalent cation-free Ringer's solution were due to Cx46 hemichannel opening, then dye influx by gap junctional/hemichannel permeable dyes should be measurable in the fiber cells. To measure dye influx, the authors used the positively charged dyes, propidium iodide (PrI) and 4'-6-diamidino-2-phenylindole (DAPI). In the absence of external calcium, fiber cells took up both dyes. Furthermore, dye influx could be inhibited by hemichannel blockers. To confirm that this current was due to Cx46 hemichannels, the authors studied fiber cells isolated from the lenses of double knockout (Cx46(-/-); Cx50(-/-)) mice and demonstrated that both the calcium-sensitive conductance and dye influx were absent.
Conclusions: These results show that Cx46 can form functional hemichannels in the nonjunctional membrane of fiber cells.
Figures

Similar articles
-
Cx46 hemichannels contribute to the sodium leak conductance in lens fiber cells.Am J Physiol Cell Physiol. 2014 Mar 1;306(5):C506-13. doi: 10.1152/ajpcell.00353.2013. Epub 2013 Dec 31. Am J Physiol Cell Physiol. 2014. PMID: 24380846 Free PMC article.
-
Hemichannel and junctional properties of connexin 50.Biophys J. 2002 Apr;82(4):2016-31. doi: 10.1016/S0006-3495(02)75550-1. Biophys J. 2002. PMID: 11916859 Free PMC article.
-
Co-expression of lens fiber connexins modifies hemi-gap-junctional channel behavior.Biophys J. 1999 Jan;76(1 Pt 1):198-206. doi: 10.1016/S0006-3495(99)77189-4. Biophys J. 1999. PMID: 9876134 Free PMC article.
-
Regulation of Connexin Gap Junctions and Hemichannels by Calcium and Calcium Binding Protein Calmodulin.Int J Mol Sci. 2020 Nov 2;21(21):8194. doi: 10.3390/ijms21218194. Int J Mol Sci. 2020. PMID: 33147690 Free PMC article. Review.
-
Gap junctions or hemichannel-dependent and independent roles of connexins in cataractogenesis and lens development.Curr Mol Med. 2010 Dec;10(9):851-63. doi: 10.2174/156652410793937750. Curr Mol Med. 2010. PMID: 21091421 Free PMC article. Review.
Cited by
-
Connexins in Cancer, the Possible Role of Connexin46 as a Cancer Stem Cell-Determining Protein.Biomolecules. 2023 Sep 27;13(10):1460. doi: 10.3390/biom13101460. Biomolecules. 2023. PMID: 37892142 Free PMC article. Review.
-
Paracrine signaling through plasma membrane hemichannels.Biochim Biophys Acta. 2013 Jan;1828(1):35-50. doi: 10.1016/j.bbamem.2012.07.002. Epub 2012 Jul 13. Biochim Biophys Acta. 2013. PMID: 22796188 Free PMC article. Review.
-
Protein kinase A activation alleviates cataract formation via increased gap junction intercellular communication.iScience. 2023 Feb 2;26(3):106114. doi: 10.1016/j.isci.2023.106114. eCollection 2023 Mar 17. iScience. 2023. PMID: 36852280 Free PMC article.
-
A recurrent missense mutation in GJA3 associated with autosomal dominant cataract linked to chromosome 13q.Mol Vis. 2011;17:2255-62. Epub 2011 Aug 20. Mol Vis. 2011. PMID: 21897748 Free PMC article.
-
Calcium-Activated Chloride Channels in Newly Differentiating Mouse Lens Fiber Cells and Their Role in Volume Regulation.Invest Ophthalmol Vis Sci. 2019 Apr 1;60(5):1621-1629. doi: 10.1167/iovs.19-26626. Invest Ophthalmol Vis Sci. 2019. PMID: 30995319 Free PMC article.
References
-
- Willecke K, Eiberger J, Degen J, et al. Structural and functional diversity of connexin genes in the mouse and human genome. Biol Chem. 2002;38361:725–737 - PubMed
-
- Ebihara L. New roles for connexons. News Physiol Sci. 2003;18:100–103 - PubMed
-
- Pfahnl A, Dahl G. Gating of Cx46 gap junction hemichannels by calcium and voltage. Pflugers Arch. 1999;43761:345–353 - PubMed
Publication types
MeSH terms
Substances
Grants and funding
LinkOut - more resources
Full Text Sources
Molecular Biology Databases
Miscellaneous
