. 2010 Sep 20;5(9):e12745.
doi: 10.1371/journal.pone.0012745.

Characterization of Epstein-Barr virus miRNAome in nasopharyngeal carcinoma by deep sequencing

Affiliations

Characterization of Epstein-Barr virus miRNAome in nasopharyngeal carcinoma by deep sequencing

Shu-Jen Chen et al. PLoS One. .

Abstract

Virus-encoded microRNAs (miRNAs) have been shown to regulate a variety of biological processes involved in viral infection and viral-associated pathogenesis. Epstein-Barr virus (EBV) is a herpesvirus implicated in nasopharyngeal carcinoma (NPC) and other human malignancies. EBV-encoded miRNAs were among the first group of viral miRNAs identified. To understand the roles of EBV miRNAs in the pathogenesis of NPC, we utilized deep sequencing technology to characterize the EBV miRNA transcriptome in clinical NPC tissues. We obtained more than 110,000 sequence reads in NPC samples and identified 44 EBV BART miRNAs, including four new mature miRNAs derived from previously identified BART miRNA precursor hairpins. Further analysis revealed extensive sequence variations (isomiRs) of EBV miRNAs, including terminal isomiRs at both the 5' and 3' ends and nucleotide variants. Analysis of EBV genomic sequences indicated that the majority of EBV miRNA nucleotide variants resulted from post-transcriptional modifications. Read counts of individual EBV miRNA in NPC tissue spanned from a few reads to approximately 18,000 reads, confirming the wide expression range of EBV miRNAs. Several EBV miRNAs were expressed at levels similar to highly abundant human miRNAs. Sequence analysis revealed that most of the highly abundant EBV miRNAs share their seed sequences (nucleotides 2-7) with human miRNAs, suggesting that seed sequence content may be an important factor underlying the differential accumulation of BART miRNAs. Interestingly, many of these human miRNAs have been found to be dysregulated in human malignancies, including NPC. These observations not only provide a potential linkage between EBV miRNAs and human malignancy but also suggest a highly coordinated mechanism through which EBV miRNAs may mimic or compete with human miRNAs to affect cellular functions.


Conflict of interest statement

Competing Interests: The authors have declared that no competing interests exist.

Figures

Figure 1
Figure 1. Overview of human and EBV miRNAs detected in NPC samples.
(A). Proportion of human and EBV miRNAs detected in T10 and N10 libraries. Read counts represent total reads mapped to miRBase-registered precursor hairpins for human and EBV miRNAs. (B). Size distribution of EBV small RNAs detected in T10 sample.
Figure 2
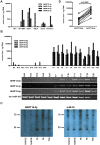
Figure 2. Detection and quantification of novel EBV miRNAs in cell lines and NPC tissues.
(A). Expression of novel EBV miRNAs in NPC and B lymphoma cells. Expression of BART12-5p, BART15-5p, BART16-3p and BART22-5p was quantified using real-time PCR in EBV-positive cells, including HK1-EBV and c666-1 NPC carcinoma cells and B95.8, Daudi and Namalwa B lymphoma cells. HK1 is an EBV-negative NPC carcinoma cell line. Expression levels of miRNA were expressed as molecules per ng total RNA. (B). Expression of novel EBV miRNAs in normal and NPC tissues. Total RNAs from 11 NPC tissues and 8 adjacent normal tissues were analyzed for novel EBV miRNA expression using real-time PCR method. Expression levels of miRNA were expressed as molecules per ng total RNA. PCR products were analyzed using 10% polyacrylamide gel. Human miRNA hsa-miR-103, a ubiquitously expressed miRNA, was used as a loading control. (C). Northern blot detection of BART16-3p in NPC and adjacent normal tissues. Total RNA (5 µg) isolated from NPC tissues and adjacent normal tissues was separated in 12.5% denaturing polyacrylamide gels and analyzed with DIG-labeled LNA probes specific for the indicated miRNAs. RNAs from sample N10 and N12, N16 and N18 were pooled and used as normal tissues. (D). Expression level of BART16-5p and BART16-3p in NPC tissues. Expression levels of BART16-5p and BART16-3p were quantified in 11 NPC tissues using real-time PCR. P-value was calculated with paired-t-test (two-tailed).
Figure 3
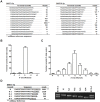
Figure 3. Length isomiRs of EBV BART miRNAs in T10.
(A). Examples of length isomiRs of EBV miRNA BART3-3p and BART10-3p. Shown are the isomiR sequences and read counts detected in the T10 sample. (B). Distribution of 5′-end heterogeneity of EBV BART miRNA in T10. To analyze the 5′-end heterogeneity, each miRNA isomiR was aligned to its corresponding miRBase reference sequence to calculate the 5′-end nucleotide offset. IsomiRs with 5′-end nucleotide extension relative to the miRBase reference were assigned a negative offset number, while isomiRs with nucleotide deletion at the 5′-end were assigned a positive offset number. The frequency of 5′ terminal heterogeneity for each miRNA was calculated by dividing the read count at each alternative end by the total read count and was expressed as terminal variation frequency. Shown are the mean frequency ± SD calculated using 35 EBV BART miRNAs whose total reads exceed 100 in the T10 sample. (C). Distribution of 3′-end heterogeneity of EBV BART miRNAs in T10. A similar strategy was used to calculate the 3′-end nucleotide offset for each miRNA isomiR. The frequency of 3′ terminal heterogeneity for each miRNA was calculated by dividing the read count at each alternative end by the total read count and was expressed as terminal variation frequency. Shown are mean frequency ± SD calculated using 35 EBV BART miRNAs whose total reads exceed 100 in T10 sample. (D). Validation of BART5-5p 3′-end isomiRs in T10 sample. Sequence and read counts of the representative 3′ terminal isomiRs of BART5-5p are shown in the left panel. Nucleotides used to design stem-loop RT primer for each terminal isomiR (N to N-4) are underlined. PCR products of individual isomiR from T10 sample were analyzed using 15% polyacrylamide gel electrophoresis. To highlight the size difference of individual isomiRs, PCR products generated from N and N-4 primer were mixed and run on both sides to serve as size markers.
Figure 4
Figure 4. Nucleotide variations of EBV BART miRNAs.
(A) Examples of nucleotide variants of BART3-3p and BART19-5p. Shown are the partial list of sequences and read counts of nucleotide variants detected in the T10 sample. Nucleotides deviated from the miRBase reference sequence are shown in lower case letters. (B) Distribution of nucleotide variation along the nucleotide positions of EBV miRNA. For individual EBV miRNAs, all sequence variants were aligned to the miRBase reference sequence to determine the nucleotide variation at each position. The variation frequency for each miRNA at each position was calculated by dividing the mismatched reads at each position by total reads. The average variation frequency of EBV miRNA at each position was calculated from 35 EBV BART miRNAs whose total reads exceed 100 in the T10 sample. A similar calculation was performed to determine the nucleotide variation frequency at each position of two EBV non-coding RNAs, EBER1 and EBER2. The frequency of nucleotide variation of EBERs and EBV miRNAs at each position was plotted on the same scale to highlight the pattern and the extent of nucleotide variation of EBV miRNAs. The nucleotide variation of EBV miRNA was clearly suppressed from nucleotides 2 to 14, covering the seed sequence and the potential miRNA:mRNA binding regions.
Figure 5
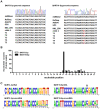
Figure 5. Nucleotide variations of EBV genomic DNA and BART miRNAs in NPC samples.
(A) Example of genomic sequence of BART3-3p and BART19-5p in NPC cell lines and tissues. Genomic DNA from HK1-EBV, c666-1 cells and five NPC tissues was sequenced and compared to three EBV genomic sequences deposited in the GenBank, including the reference sequence of the EBV genome (RefSeq), AG876 and GD1. No nucleotide mismatch was found for BART3-3p in all NPC samples. A T to C nucleotide polymorphism at nt 17 of BART19-5p was found in c666-1 and four of the five NPC tissues. (B) Frequency of nucleotide variation in BART3-3p and BART19-5p miRNA detected in T10. For BART3-3p and BART19-5p, the frequency of nucleotide variation at each position was calculated by dividing the mismatched reads at each position by total reads. A greater than 90% variation frequency was detected at nt 17 of BART19-5p, corresponding to the T/C polymorphism found in the genomic sequence. (C) Sequence logos of BART3-3p and BART19-5p genomic DNA and miRNAs. DNA sequence logos were generated using all of the genomic sequences listed in Figure 5A, including three EBV genome sequences from GenBank and seven sequences from NPC samples. MiRNA sequence logos were generated using sequences of all unique isomiRs for BART3-3p and BART19-5p. Sequence logos represent the frequency of nucleotides detected at each position.
Figure 6
Figure 6. Expression levels and seed sequence conservation of EBV BART miRNAs in NPC samples.
(A) Read counts of all EBV miRNAs detected in T10. Read counts for each miRNA include all terminal isomiRs and nucleotide variants. (B) Correlation between SOLiD read counts and real-time PCR expression levels of EBV miRNAs detected in T10. Twenty-five BART miRNAs in the T10 sample were quantified using real-time PCR. Expression levels of miRNA are expressed as molecules per ng total RNA. To calculate the correlation, total reads from SOLiD sequence and expression levels from real-time PCR were log2-transformed and analyzed using Person's correlation analysis. Pearson's correlation coefficient and p-value are shown in the inserts. (C) Conservation of BART miRNA expression pattern in NPC tissues and cell lines. Expression levels of 25 BART miRNAs in 13 NPC tissues and c666-1 cells were quantified using real-time PCR. Correlation analysis was performed on log2-transformed data to determine the similarity of BART miRNA expression patterns among these samples. Data shown in the lower left portion are Pearson's correlation coefficients. Values shown in the upper right portion are Spearman's correlation coefficients. Both correlation analyses show a high degree of similarity in BART miRNA expression patterns among these NPC samples and c666-1 cells.
Figure 7
Figure 7. Expression levels of human miRNAs sharing seed sequences with highly abundant EBV BART miRNAs in NPC samples.
(A) Sequence alignments between EBV miRNAs and human miRNAs. Seed sequences are underlined. (B) Expression levels of human miRNAs miR-18a, miR-18b, miR-200a and miR-29c in 9 normal and 13 NPC clinical tissues. The miRNA expression levels are presented as 39– Ct after normalization to u6 small RNA. P-values were calculated using t-test. Shown are the means ± sd.

Similar articles

Cited by

References

    1. Burgos JS. Involvement of the Epstein-Barr virus in the nasopharyngeal carcinoma pathogenesis. Med Oncol. 2005;22:113–121. - PubMed
    1. Middeldorp JM, Pegtel DM. Multiple roles of LMP1 in Epstein-Barr virus induced immune escape. Semin Cancer Biol. 2008;18:388–396. - PubMed
    1. Iwakiri D, Takada K. Role of EBERs in the pathogenesis of EBV infection. Adv Cancer Res. 2010;107:119–136. - PubMed
    1. Yoshizaki T. Promotion of metastasis in nasopharyngeal carcinoma by Epstein-Barr virus latent membrane protein-1. Histol Histopathol. 2002;17:845–850. - PubMed
    1. Swaminathan S. Noncoding RNAs produced by oncogenic human herpesviruses. J Cell Physiol. 2008;216:321–326. - PMC - PubMed

Publication types