. 2010 Sep 20;5(9):e12807.
doi: 10.1371/journal.pone.0012807.

Petri Nets with Fuzzy Logic (PNFL): reverse engineering and parametrization

Affiliations

Petri Nets with Fuzzy Logic (PNFL): reverse engineering and parametrization

Robert Küffner et al. PLoS One. .

Abstract

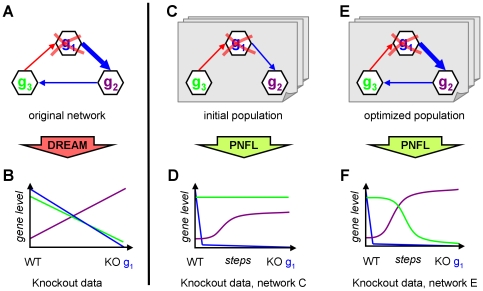
Background: The recent DREAM4 blind assessment provided a particularly realistic and challenging setting for network reverse engineering methods. The in silico part of DREAM4 solicited the inference of cycle-rich gene regulatory networks from heterogeneous, noisy expression data including time courses as well as knockout, knockdown and multifactorial perturbations.

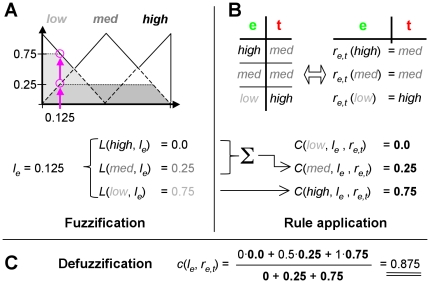
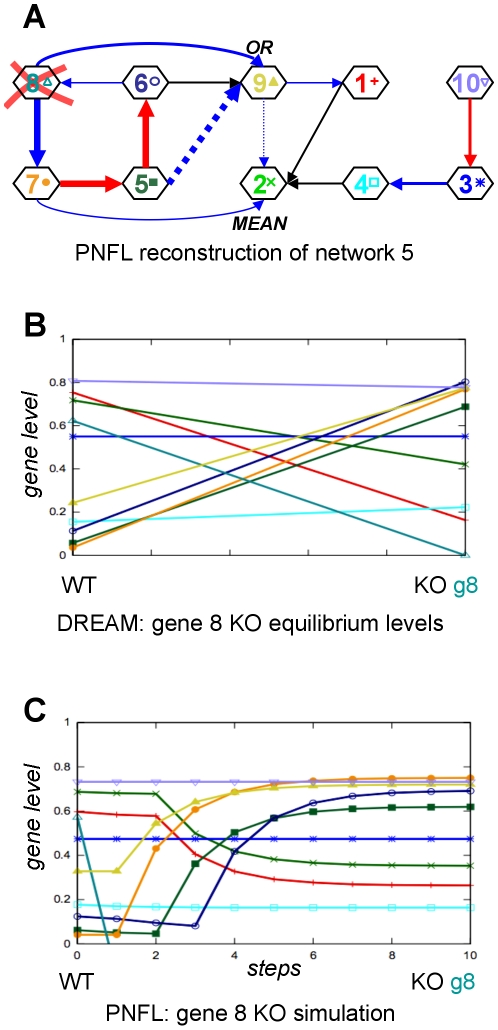
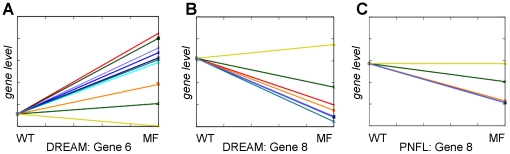
Methodology and principal findings: We inferred and parametrized simulation models based on Petri Nets with Fuzzy Logic (PNFL). This completely automated approach correctly reconstructed networks with cycles as well as oscillating network motifs. PNFL was evaluated as the best performer on DREAM4 in silico networks of size 10 with an area under the precision-recall curve (AUPR) of 81%. Besides topology, we inferred a range of additional mechanistic details with good reliability, e.g. distinguishing activation from inhibition as well as dependent from independent regulation. Our models also performed well on new experimental conditions such as double knockout mutations that were not included in the provided datasets.

Conclusions: The inference of biological networks substantially benefits from methods that are expressive enough to deal with diverse datasets in a unified way. At the same time, overly complex approaches could generate multiple different models that explain the data equally well. PNFL appears to strike the balance between expressive power and complexity. This also applies to the intuitive representation of PNFL models combining a straightforward graphical notation with colloquial fuzzy parameters.


Conflict of interest statement

Competing Interests: The authors have declared that no competing interests exist.

Figures

Figure 1
Figure 1. Petri Nets with Fuzzy Logic (PNFL).
In Petri nets, states such as effector (e) or target (t) gene levels are represented by places and are depicted as circles. State changes are represented by transitions and are depicted as boxes. Effect arcs (i.e. effector place-transition arcs) define the effectors influencing a target gene via the transition. Firing transitions leaves the marking of the effector places unchanged (test arcs, dashed). After the application of rule tables re,t to effector gene levels le (function c, eq. 1–3), the target gene levels lt are updated by the output function o (eq. 4–6). In Fig. 6, Fig. 8 and Fig. 10, we represent a transition and its output place as a simplified hexagonal node. The reconstruction determines the topology ( = effect arcs) and the parametrization ( = rule tables and combination operators) of PNFL models.
Figure 2
Figure 2. Fuzzification and defuzzification.
We use triangular membership functions to fuzzify the continuous gene levels of an effector e into fuzzy sets. As shown by the magenta arrow, a continuous gene level of le = 0.25 is fuzzified into the fuzzy value <L(low,le) = 0.5, L(med,le) = 0.5, L(high,le) = 0.0>. This can be reversed by defuzzification without loss of information.
Figure 3
Figure 3. Rule tables.
Given fuzzy effector gene levels, we describe the behavior of the targets by rule tables. Rule tables define sign and strength of effects. Fully active strong (−−−, A) or medium (−−, B) inhibitors result in low target activity, which is in contrast to weak inhibitors (−, C). The corresponding strong (+++), medium (++) and weak (+) activator rule tables are constructed by exchanging high by low and low by high in the target column.
Figure 4
Figure 4. Fuzzy effect calculation example.
In this example, the gene level of effector e is le = 0.125. It is transformed (fuzzified, panel A) into the fuzzy gene level L by application of eq. 1. In panel B, the rule table re,t (Fig. 3C) is applied to describe the influence of e onto its target gene t by the rule consequent C. C is derived by eq. 2, yielding the fuzzy value <0, 0.25, 0.75> (panel B). The real valued influence of e onto t, c(le, re,t) = 0.875, is calculated by defuzzification (panel C). Such a calculation is performed for all effectors of the target gene t individually. The influences are combined by eq. 4 or eq. 6 (not shown here, see text).
Figure 5
Figure 5. Combinatorial gene regulation.
The regulatory logic of different transcription factors (TFs) regulating a target gene used in DREAM4 was disclosed after the challenge. TFs are assumed to bind to cis-regulatory modules (CRMs) to regulate the expression of target genes. Individual CRMs act as enhancers (red) or repressors (blue) of gene regulation. The bound states of different CRMs (e.g. by TFs 4 and 10) are mutually independent. A complex of TFs regulating a given CRM can be represented as AND operator. TFs 1 and 7 are mutually dependent to form the complex and regulate the gene. In turn, a complex of TFs controlling a repressing CRM can be implemented by the OR operator (not shown). The effects of several CRMs on the activity of the target gene are averaged (MEAN operator). In contrast to the arbitrary combination of operators in the DREAM4 approach, PNFL selects only a single operator (AND, OR or MEAN) per target gene (see Methods and Results). The depicted regulation of gene 3 was taken from network 5 (see Fig. 10A).
Figure 6
Figure 6. Overview network reconstruction.
To reconstruct the original network (A) we mimic the DREAM4 data generation process (A→B). The knockout (KO) of gene 1 is depicted as an example data set in the lower panels. Our reconstruction starts from a randomly initialized population (C) and proceeds through network changing moves. After each move, data is generated by PNFL (D) and compared against the DREAM data (B). We implemented moves on single networks in the population and crossover moves that copy features between pairs of networks. Thereby, favourable features are propagated throughout the population, which eventually leads to improved networks (E) and corresponding datasets (F). Note that - in contrast to the PNFL simulation (D,F) - only equilibrium values were given for knockout experiments in DREAM4 (B). Edges denote effect strength (thickness) and sign (activation = red, inhibition = blue).
Figure 7
Figure 7. Evaluation of the in silico challenge comprising five networks of ten genes.
Panel A shows the prediction performance of the directed unsigned topology as the area under the precision recall curve (AUPR). In a bonus challenge, steady-state level predictions of dual knockout experiments were evaluated by the mean squared error (MSE, panel B). Our performance is shown in green.
Figure 8
Figure 8. PNFL reconstruction of network 5 (AUPR = 76%).
DREAM4 evaluated our predictions (panel A) in terms of correct (colored solid), missed (black) and surplus (dotted) edges. For simulation, we also infer three levels of effect strength (edge thickness) for both activation (red) and inhibition (blue). Targets regulated by multiple effectors are parametrized by the kind of regulation, i.e. dependent (AND, OR) vs. independent (MEAN). Incorrect predictions are more frequent when effector gene levels are low in the wild type (e.g. genes 4, 5, 6 and 9). In panels A and B we compare the provided DREAM data to the PNFL simulation for the knockout of gene 8.
Figure 9
Figure 9. Generation of multifactorial (MF) data for an effect in network 5.
In network 5, gene 6 is the only effector for gene 8 (see Fig. 8). Effectors are initialized by the provided MF gene levels (A). Subsequently, individual PNFL transitions are applied to compute the MF gene levels for the targets (C). The objective function compares the target gene levels of the provided MF data (B) to the PNFL outputs (C).
Figure 10
Figure 10. PNFL reconstruction of network 1 (AUPR = 92%).
Shown is our reconstruction of network 1 (A) and the data of time course 2 as provided by DREAM (B) or simulated by PNFL (C). Time course data shows how the network responds to the application and removal of perturbations. In addition to effector targets (eq. 4), we also predict perturbation targets (eq. 6). According to our reconstruction, perturbation p2 in time course 2 affects genes 3 and 7.

References

    1. de Jong H. Modeling and simulation of genetic regulatory systems: a literature review. J Comput Biol. 2002;9(1):67–103. - PubMed
    1. Brazhnik P, de la Fuente A, Mendes P. Gene networks: how to put the function in genomics. Trends Biotechnol. 2002;20(11):467–72. - PubMed
    1. Bansal M, Belcastro V, Ambesi-Impiombato A, di Bernardo D. How to infer gene networks from expression profiles. Mol Syst Biol. 2007;3:78. - PMC - PubMed
    1. Markowetz F, Spang R. Inferring cellular networks–a review. BMC Bioinformatics. 2007;8(Suppl 6):S5. - PMC - PubMed
    1. Li H, Xuan J, Wang Y, Zhan M. Inferring regulatory networks. Front Biosci. 2008;13:263–75. - PubMed

Publication types