. 2010 Sep 17;5(9):e12825.
doi: 10.1371/journal.pone.0012825.

Differentiation in neuroblastoma: diffusion-limited hypoxia induces neuro-endocrine secretory protein 55 and other markers of a chromaffin phenotype

Affiliations

Differentiation in neuroblastoma: diffusion-limited hypoxia induces neuro-endocrine secretory protein 55 and other markers of a chromaffin phenotype

Fredrik Hedborg et al. PLoS One. .

Abstract

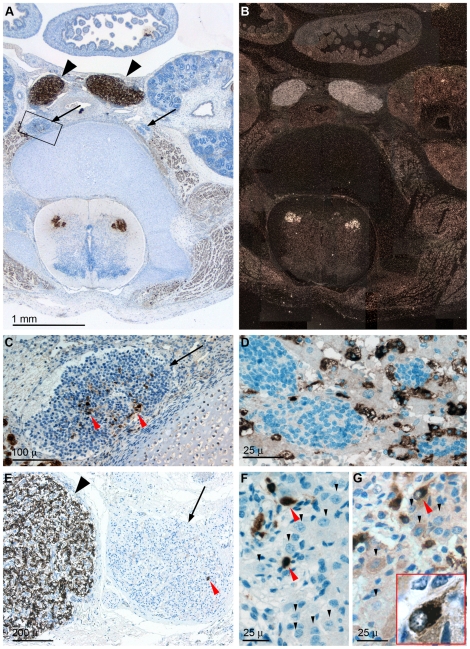
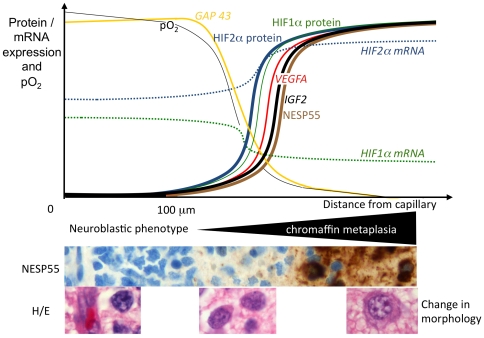
Background: Neuroblastoma is a childhood malignancy of sympathetic embryonal origin. A high potential for differentiation is a hallmark of neuroblastoma cells. We have previously presented data to suggest that in situ differentiation in tumors frequently proceeds along the chromaffin lineage and that decreased oxygen (hypoxia) plays a role in this. Here we explore the utility of Neuro-Endocrine Secretory Protein 55 (NESP55), a novel member of the chromogranin family, as a marker for this process.

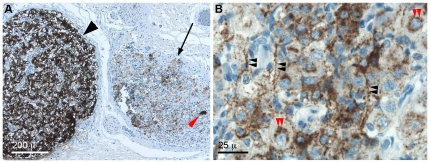
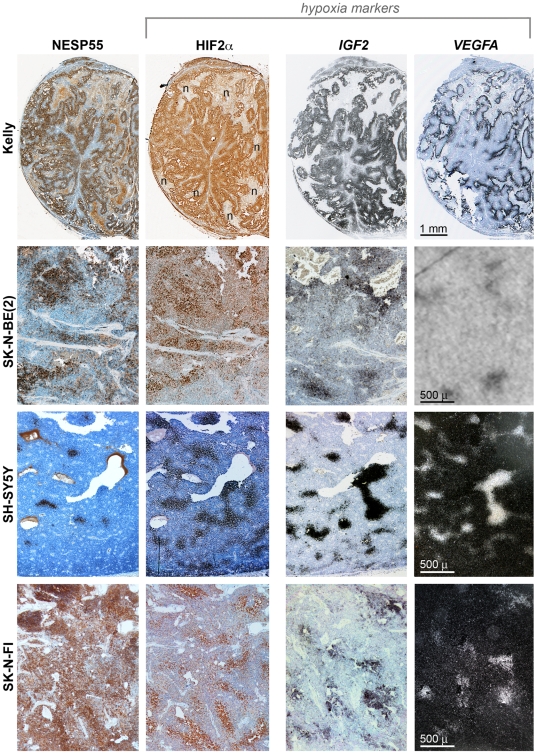
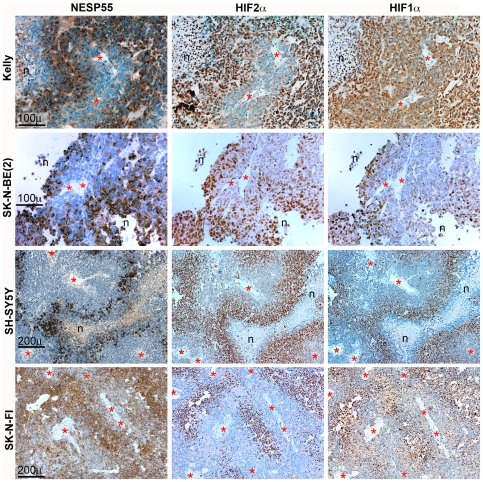
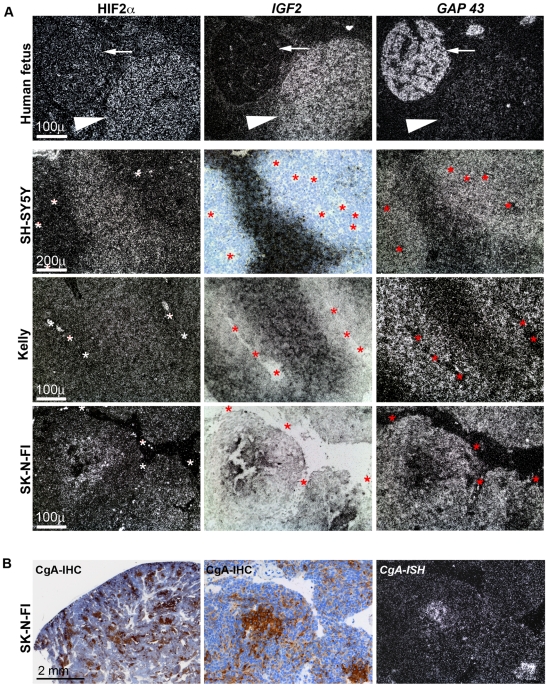
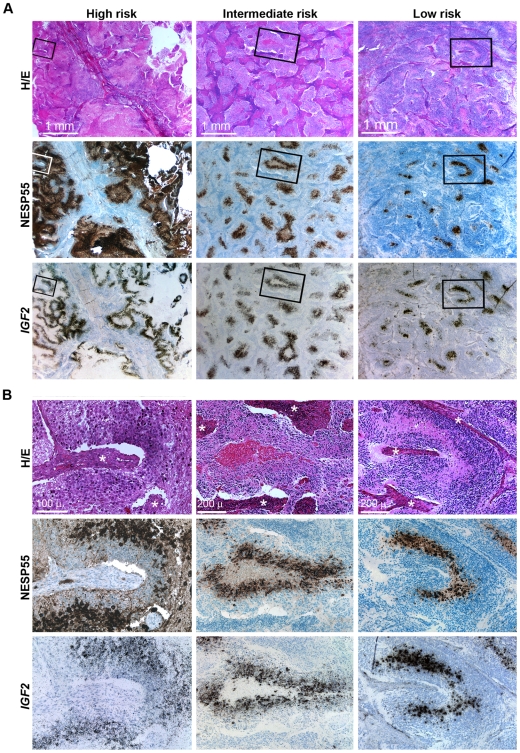
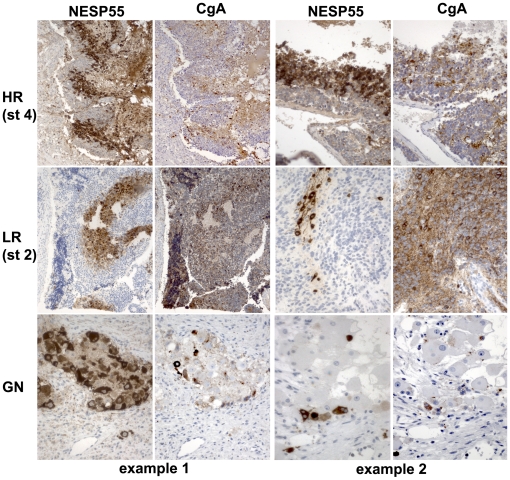
Methodology/principal findings: Immunohistochemical analyses and in situ hybridizations were performed on human fetal tissues, mouse xenografts of human neuroblastoma cell lines, and on specimens of human neuroblastoma/ganglioneuroma. Effects of anaerobic exposure on gene expression by cultured neuroblastoma cells was analyzed with quantitative real-time PCR. Fetal sympathetic nervous system expression of NESP55 was shown to be specific for chromaffin cell types. In experimental and clinical neuroblastoma NESP55 immunoreactivity was specific for regions of chronic hypoxia. NESP55 expression also correlated strikingly with morphological evidence of differentiation and with other chromaffin-specific patterns of gene expression, including IGF2 and HIF2α. Anaerobic culture of five neuroblastoma cell lines resulted in an 18.9-fold mean up-regulation of NESP55.

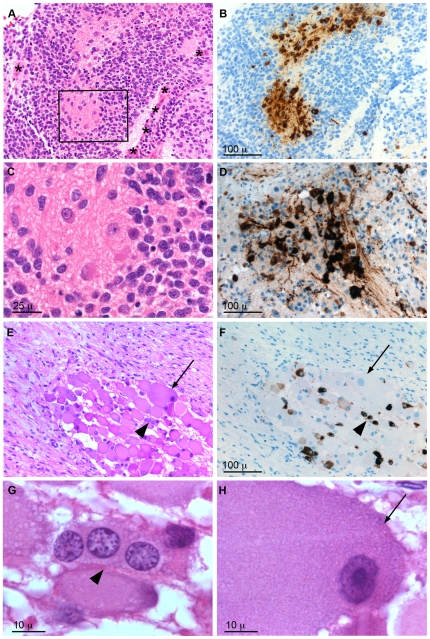
Conclusions/significance: The data confirms that chronic tumor hypoxia is a key microenvironmental factor for neuroblastoma cell differentiation, causing induction of chromaffin features and NESP55 provides a reliable marker for this neuronal to neuroendocrine transition. The hypoxia-induced phenotype is the predominant form of differentiation in stroma-poor tumors, while in stroma-rich tumors the chromaffin phenotype coexists with ganglion cell-like differentiation. The findings provide new insights into the biological diversity which is a striking feature of this group of tumors.


Conflict of interest statement

Competing Interests: PHM is a Director and shareholder in ReOx Ltd. This does not alter the authors' adherence to all the PLoS ONE policies on sharing data and materials, as detailed online in the guide for authors.

Figures

Figure 1
Figure 1. Sympathetic nervous system expression of NESP55 during human development.
A and B: NESP55 immunohistochemistry (A) and NESP55 in situ hybridization (B) results from consecutive mid-abdominal sections of a nine week old fetus (developmental age) containing the organ of Zuckerkandl, i. e. the largest sympathetic paraganglia of the body, and sympathetic trunk ganglia. Other organs are: small intestine, kidneys, aorta, spinal cord, vertebra and paravertebral muscles. C and D: NESP55 immunoreactivity of sympathetic cell types in (C): an abdominal sympathetic trunk ganglion at age nine weeks, and (D): of the adrenal medulla at 18 weeks of development. Panel C is a high power view of boxed region in A and shows pericentric presence of NESP55 immunoreactive small intensely fluorescent (SIF) cells. Panel D shows adrenal tissue containing nests of sympathetic neuroblastic cells and NESP55 immunoreactive medullary chromaffin cells mixed with cortical cells. EG: NESP55 immunoreactivity of para-adrenal sympathetic tissue of a term fetus. Panel E depicts a sympathetic paraganglion and an adjacent sympathetic ganglion. Panel F is a high power view of a sympathetic ganglion of the same specimen. G: Same ganglion as in F, tested with a four-fold higher anti-NESP55 antibody concentration. Insert is a high power view of an indicated SIF cell. Symbols: Large black arrowheads: sympathetic paraganglia; arrows: sympathetic ganglia, red arrowheads: SIF cells, small black arrowheads: ganglion cells.
Figure 2
Figure 2. Chromogranin A immunoreactivity of the human fetal sympathetic nervous system.
A: Sympathetic paraganglion and adjacent sympathetic ganglion of a term fetus. Same region as shown in Figure 1 panel E, analyzed in a consecutive section. B: High-power view of a sympathetic ganglion from the same section. Symbols: black arrowhead: sympathetic paraganglion; arrow: sympathetic ganglion, red arrowhead: SIF cell. Black double arrowheads indicate axonal stainings and red double arrowheads indicate perinuclear stainings of ganglion cells.
Figure 3
Figure 3. NESP55 immunoreactivity and histological evidence of hypoxia in neuroblastoma xenografts.
Columns represent NESP55/HIF2α immunoreactivities and IGF2/VEGFA in situ hybridization (ISH) results, as shown. Rows represent different cell lines, as described. In each row the same tumor region is shown for the different analyses. NESP55/HIF2α results are produced from consecutive sections. IGF2/VEGFA results are from consecutive sections that are adjacent, but not consecutive, to the former sections. HIF2α immunoreactivity and IGF2/VEGFA expressions were chosen as markers for cellular hypoxia. IGF2 ISH results and VEGFA ISH results for Kelly are shown in brightfield view (silver grains appear in black). VEGFA expression in SK-N-BE(2) is represented by an x-ray film autoradiography and VEGFA ISH results for SH-SY5Y and SK-N-FI xenografts are shown in darkfield view (silver grains appear in white). Symbol: n: areas of necrosis.
Figure 4
Figure 4. Arrangements of NESP55, HIF2α and HIF1α immunoreactive cells in neuroblastoma xenografts related to fibro-vascular stroma.
Columns represent the different immunohistochemical analyses, as indicated, and rows show a tumor region, analyzed in consecutive sections, of mouse xenografts derived from four different neuroblastoma cell lines, as indicated. Symbols: n: areas of necrosis; asterisks: vascular lumina.
Figure 5
Figure 5. NESP55-independent evidence of a chromaffin hypoxic phenotype in neuroblastoma xenografts.
A: Columns show HIF2α, IGF2 and GAP 43 in situ hybridization results, as indicated. The specificities of these expressions within the early sympathetic nervous system are shown in the upper row, representing consecutive sections of a 12 week fetal specimen containing a sympathetic ganglion and a sympathetic paraganglion, as indicated. The rows below represent consecutive sections from three different neuroblastoma xenograft tumors, as indicated. Silver grains appear in black in panels showing IGF2 expression (brightfield illumination). In all other panels silver grains appear in white (darkfield illumination). IGF2 ISH is used here as a combined marker for a chromaffin phenotype and for tumor hypoxia. Symbols: arrows: sympathetic ganglion; arrowheads: sympathetic paraganglion; asterisks: vascular structures. B: Chromogranin A expression in a SK-N-FI neuroblastoma xenograft. Left and middle panels depict chromogranin A immunoreactivity at two different magnifications. Right panel shows a chromogranin A in situ hybridization result in darkfield view from a consecutive section. Middle and right panels represent the same tumor region as depicted in the bottom row of Fig. 5: A.
Figure 6
Figure 6. NESP55 immunoreactivity and IGF2 expression in clinical variants of neuroblastoma.
A: Low power magnification: First column: abdominal stage 4 tumor with a poor patient outcome. Second column: abdominal stage 3 tumor of an adolescent. Patient outcome was poor due to complications after myeloablative therapy. Third column: abdominal infant stage 3 tumor with a favourable clinical outcome. All specimens were obtained prior to start of chemotherapy. B: High power views of the same sections (boxed regions in A): Symbol: asterisks: fibro-vascular stroma.
Figure 7
Figure 7. Morphological features of NESP55 immunoreactive cells in clinical neuroblastoma and in ganglioneuroma.
A–C: Favourable outcome, stroma-poor infant stage 3 neuroblastoma. Boxed region in panel A is shown in panel C. D: prognostically unfavourable, stroma-poor adolescent stage 4 neuroblastoma. E–H: Stroma-rich ganglioneuroma. G and H show the respective nuclear morphologies of cells indicated in E. Panels A, C, E, G and H are haematoxylin-eosin stanings and panels B, D and F show NESP55 immunoreactivity. Panels B and F are from sections consecutive to A and E, respectively. Symbols: asterisks: fibro-vascular stroma, arrowheads: indicate a group of three NESP55 immunoreactive cells, arrows: indicate a large tumor cell lacking NESP55 immunoreactivity.
Figure 8
Figure 8. Regional co-expression of NESP55 and chromogranin A in clinical subtypes of neuroblastoma.
Each row represents a clinical subset of sympathetic neuroblastic tumors showing NESP55 and chromogranin A immunoreactivity in consecutive sections, as exemplified in two separate tumors. The upper two rows represent tumors with a stroma-poor histology and bottom row shows nests of tumor cells within a stroma-rich environment from two ganglioneuromas. Note a more general membraneous/neuritic chromogranin A immunoreactivity in some of the specimens, as compared to cytoplasmic staining for chromogranin A in regions of NESP55 immunoreactivity. Abbreviations: CgA: chromogranin A; HR: high-risk neuroblastoma according to INRG criteria, LR: low-risk neuroblastoma according to INRG criteria; st 4: INSS stage 4 (metastatic); st 2: INSS stage 2; GN: ganglioneuroma
Figure 9
Figure 9. Schematic summary of the studied effects of diffusion-limited hypoxia in neuroblastoma.
x-axis symbolizes the distance from tumor capillary and y-axis symbolizes the relative levels of marker gene expression and of oxygen tension (pO2). Photo images exemplify the microvascular-dependence of NESP55 immunoreactivity and of changes in cell morphology. Photo images are from the same tumor region of an infant neuroblastoma, taken from consecutive sections. Black triangle symbolizes the region of increasing chromaffin metaplasia parallel to decreasing tissue oxygen tension.

Similar articles

Cited by

References

    1. Brodeur G, Sawada T, Tsuchida Y, Voûte P, editors. Amsterdam: Elsevier; 2000. Neuroblastoma.582
    1. Reynolds CP, Matthay KK, Villablanca JG, Maurer BJ. Retinoid therapy of high-risk neuroblastoma. Cancer Lett. 2003;197:185–192. - PubMed
    1. Pahlman S, Mamaeva S, Meyerson G, Mattsson ME, Bjelfman C, et al. Human neuroblastoma cells in culture: a model for neuronal cell differentiation and function. Acta Physiol. 1990;Scand(Suppl 592):25–37. - PubMed
    1. Liu S, Tian Y, Chlenski A, Yang Q, Salwen HR, et al. ‘Cross-talk’ between Schwannian stroma and neuroblasts promotes neuroblastoma tumor differentiation and inhibits angiogenesis. Cancer Lett. 2005;228:125–131. - PubMed
    1. Schramm A, Schulte JH, Astrahantseff K, Apostolov O, Limpt V, et al. Biological effects of TrkA and TrkB receptor signaling in neuroblastoma. Cancer Lett. 2005;228:143–153. - PubMed

Publication types

MeSH terms