

A molecular score by quantitative PCR as a new prognostic tool at diagnosis for chronic lymphocytic leukemia patients
- PMID: 20862275
- PMCID: PMC2940823
- DOI: 10.1371/journal.pone.0012780
A molecular score by quantitative PCR as a new prognostic tool at diagnosis for chronic lymphocytic leukemia patients
Abstract
Background: Several markers have been proposed to predict the outcome of chronic lymphocytic leukemia (CLL) patients. However, discordances exist between the current prognostic factors, indicating that none of these factors are totally perfect.
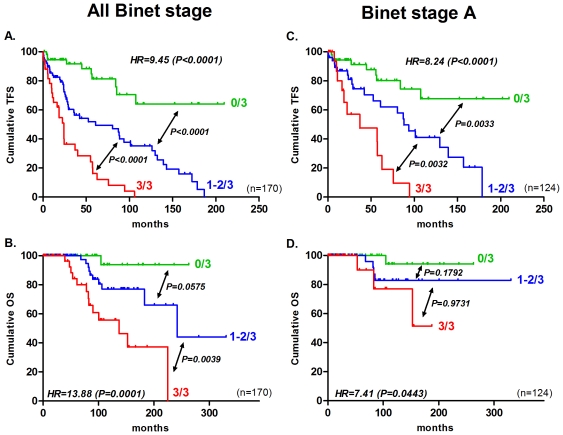
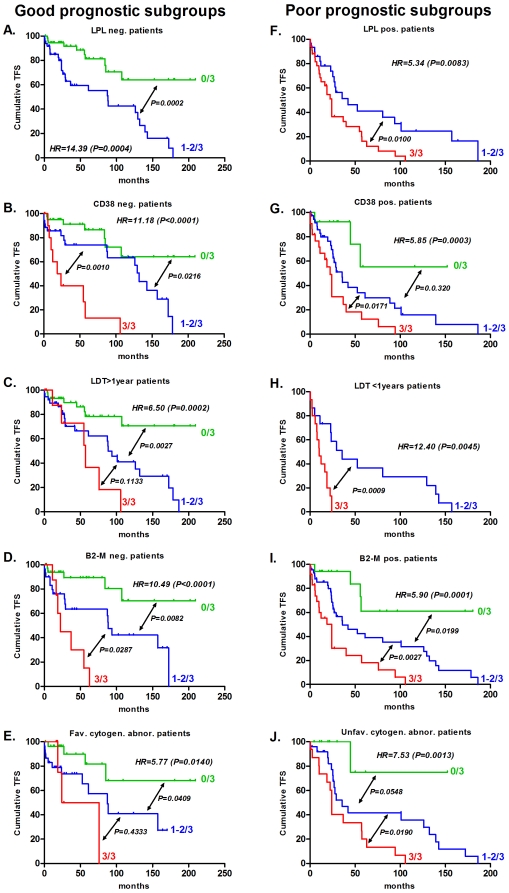
Methodology/principal findings: Here, we compared the prognostic power of new RNA-based markers in order to construct a quantitative PCR (qPCR) score composed of the most powerful factors. ZAP70, LPL, CLLU1, microRNA-29c and microRNA-223 were measured by real time PCR in a cohort of 170 patients with a median follow-up of 64 months (range3-330). For each patient, cells were obtained at diagnosis and RNA was extracted from purified CD19 cells. The best markers were included in a qPCR score, which was thereafter compared to each individual factor. Statistical analysis showed that all five RNA-based markers can predict treatment-free survival (TFS), but only ZAP70, LPL and microRNA-29c could significantly predict overall survival (OS). These three markers were thus included in a simple qPCR score that was able to significantly predict TFS and OS by dividing patients into three groups (0/3, 1-2/3 and 3/3). Median TFS were >210, 61 and 24 months (P<0.0001) and median OS were >330, 242 and 137 months (P<0.0001), respectively. Interestingly, TFS results were also confirmed in Binet stage A patients (P<0.0001). When compared to other classical factors, this score displays the highest univariate Cox hazard ratio (TFS: HR=9.45 and OS: HR=13.88) but also provides additional prognostic information.
Conclusions: In our hands, this score is the most powerful tool for CLL risk stratification at the time of diagnosis.
Conflict of interest statement
Figures


References
-
- Van Bockstaele F, Verhasselt B, Philippe J. Prognostic markers in chronic lymphocytic leukemia: a comprehensive review. Blood Rev. 2009;23:25–47. - PubMed
-
- Hamblin T. Chronic lymphocytic leukaemia: one disease or two? Ann Hematol. 2002;81:299–303. - PubMed
-
- Rai KR, Sawitsky A, Cronkite EP, Chanana AD, Levy RN, et al. Clinical staging of chronic lymphocytic leukemia. Blood. 1975;46:219–234.
-
- Binet JL, Auquier A, Dighiero G, Chastang C, Piguet H, et al. A new prognostic classification of chronic lymphocytic leukemia derived from a multivariate survival analysis. Cancer. 1981;48:198–206. - PubMed
-
- Hamblin TJ, Davis Z, Gardiner A, Oscier DG, Stevenson FK. Unmutated Ig V(H) genes are associated with a more aggressive form of chronic lymphocytic leukemia. Blood. 1999;94:1848–1854. - PubMed
Publication types
MeSH terms
Substances
LinkOut - more resources
Full Text Sources
Other Literature Sources
Research Materials
