Comparative Study
. 2010 Sep 16;5(9):e12770.
doi: 10.1371/journal.pone.0012770.

Distinct transcriptome expression of the temporal cortex of the primate Microcebus murinus during brain aging versus Alzheimer's disease-like pathology

Affiliations
Comparative Study

Distinct transcriptome expression of the temporal cortex of the primate Microcebus murinus during brain aging versus Alzheimer's disease-like pathology

Ronza Abdel Rassoul et al. PLoS One. .

Abstract

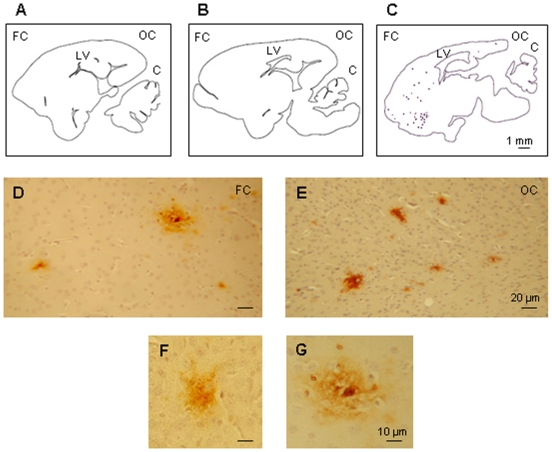
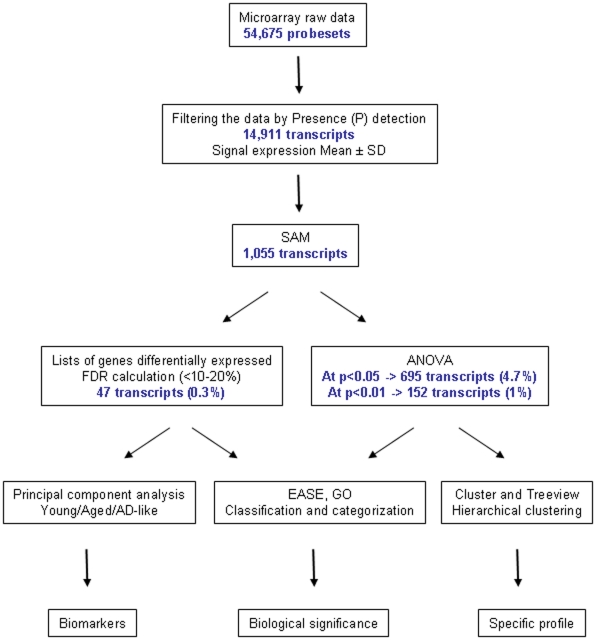
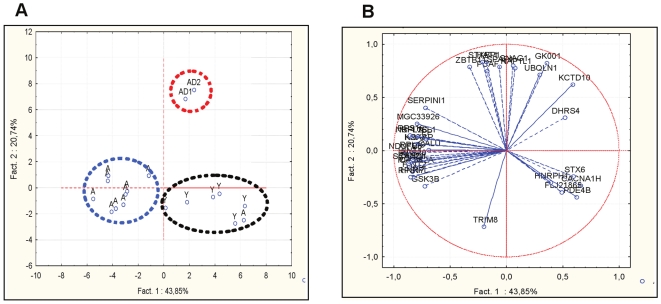
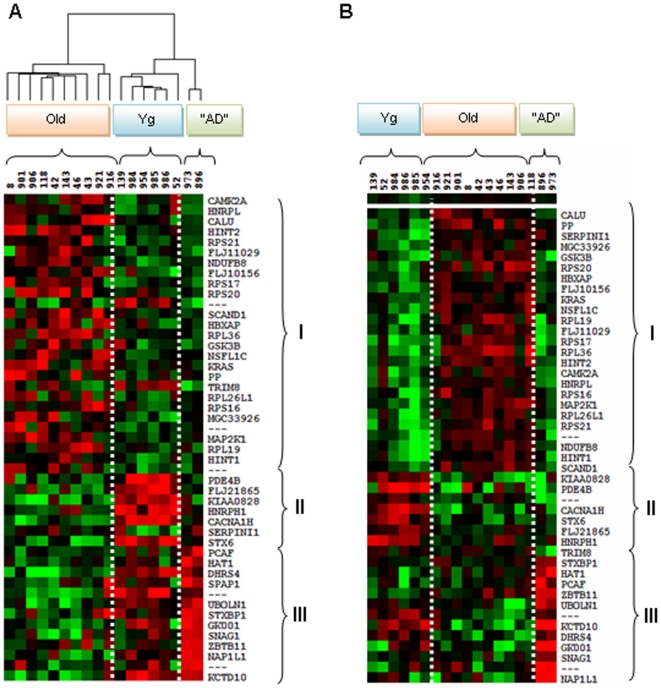
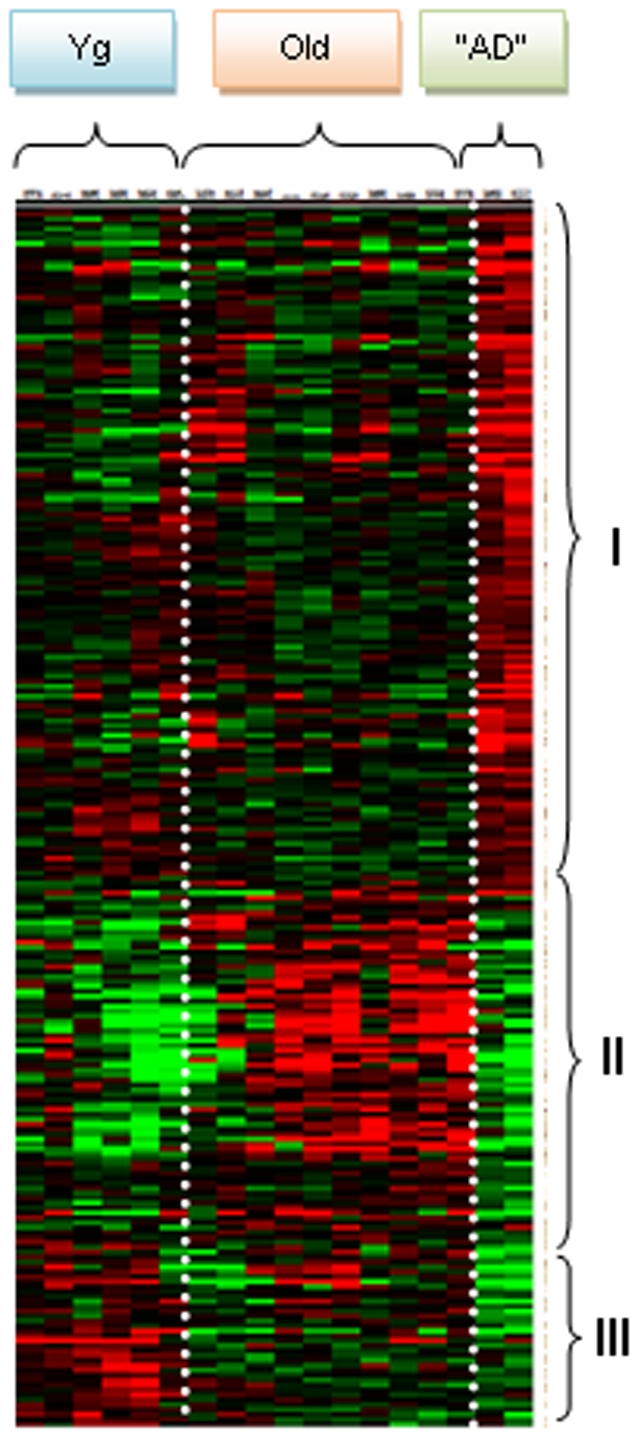
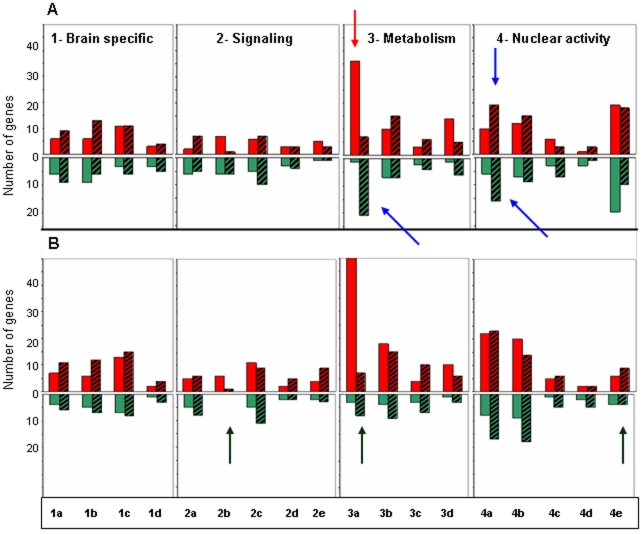
Aging is the primary risk factor of neurodegenerative disorders such as Alzheimer's disease (AD). However, the molecular events occurring during brain aging are extremely complex and still largely unknown. For a better understanding of these age-associated modifications, animal models as close as possible to humans are needed. We thus analyzed the transcriptome of the temporal cortex of the primate Microcebus murinus using human oligonucleotide microarrays (Affymetrix). Gene expression profiles were assessed in the temporal cortex of 6 young adults, 10 healthy old animals and 2 old, "AD-like" animals that presented ß-amyloid plaques and cortical atrophy, which are pathognomonic signs of AD in humans. Gene expression data of the 14,911 genes that were detected in at least 3 samples were analyzed. By SAM (significance analysis of microarrays), we identified 47 genes that discriminated young from healthy old and "AD-like" animals. These findings were confirmed by principal component analysis (PCA). ANOVA of the expression data from the three groups identified 695 genes (including the 47 genes previously identified by SAM and PCA) with significant changes of expression in old and "AD-like" in comparison to young animals. About one third of these genes showed similar changes of expression in healthy aging and in "AD-like" animals, whereas more than two thirds showed opposite changes in these two groups in comparison to young animals. Hierarchical clustering analysis of the 695 markers indicated that each group had distinct expression profiles which characterized each group, especially the "AD-like" group. Functional categorization showed that most of the genes that were up-regulated in healthy old animals and down-regulated in "AD-like" animals belonged to metabolic pathways, particularly protein synthesis. These data suggest the existence of compensatory mechanisms during physiological brain aging that disappear in "AD-like" animals. These results open the way to new exploration of physiological and "AD-like" aging in primates.


Conflict of interest statement

Competing Interests: The authors have declared that no competing interests exist.

Figures

Figure 1
Figure 1. Brain sections and ß-amyloid plaques detection.
Brain sagittal sections, localized at L 2.80 and L 3.00 from the median line according to the stereotaxic atlas of Microcebus murinus . The contour of the brain slice was drawn with the Mercator software (ExploraNova, La Rochelle, France). A. Young adult lemur (Nbr 986) B. Healthy old lemur (Nbr 43) C. AD-like old lemur (Nbr 896). Frontal cortex (FC), occipital cortex (OC), cerebellum (C), lateral ventricle (LV). Amyloid deposits representative of the two “AD-like” lemurs, in the frontal cortex (D) and the occipital cortex (E). Higher magnification showing labeling of ß-amyloid plaques (F and G).
Figure 2
Figure 2. Schematic representation of the different analyses.
Microarray data were filtered to detect the present transcripts (P). Then the filtered data were processed by SAM. ANOVA was performed with the (P) data and with the data sorted by SAM and the 47 P selected genes were analyzed by PCA. Finally, the 47 and the 695 genes were investigated by clustering and were classified by functional categories.
Figure 3
Figure 3. Principal component analysis of the 47 transcripts that are differentially regulated in aging or “AD-like” brain detected by SAM.
A. Projection of the individuals shows that healthy aged animals can be discriminated from the young ones (axis 1), and “AD-like” can be differentiated from healthy old animals (axis 2). B. Projection of the genes. Genes located to the left of axis 1 characterize healthy aged animals, whereas genes located at the top of axis 2 characterize the “AD-like” group. Young (Y), aged (A) and “AD-like” (AD) animals.
Figure 4
Figure 4. Transcriptional profiles in the temporal cortex of Microcebus murinus.
Hierarchical clustering obtained with the 47 genes sorted by SAM. The transcriptional profiles of the temporal cortex of the 18 Microcebus murinus (i.e., 6 young adults (Yg), 10 old lemurs (Old) and 2 “AD-like” (AD)) showed three distinct profiles for the 3 groups. Each profile could be separated in three distinct regions which were conserved in the three groups. (A) Dendogram and clustering showing that the animals were clustered by age or by pathology. (B) Hierarchical clustering of lemurs according to age and pathology. The clusters show that the expression of some genes in “AD-like” lemurs is similar to that in young animals. The profiles of healthy elderly animals are drastically different from those of the two “AD-like” lemurs. In the three different parts: I- genes that are down-regulated in aging and in “AD-like” animals; II- genes that are up-regulated with young adults but are down-regulated in “AD-like” animals; III- genes that are down-regulated in old and up-regulated in “AD-like” animals. Red: over-expressed genes; green: down-regulated genes; black: genes without expression changes.
Figure 5
Figure 5. Transcriptional profiles in the temporal cortex of Microcebus murinus.
Hierarchical clustering obtained with the 695 genes sorted by ANOVA. The transcriptional profiles of the 18 Microcebus murinus (i.e., 6 young adults (Yg), 10 old lemurs (Old) and 2 “AD-like” (AD)) showed 3 distinct regions: I- genes that are up-regulated in “AD-like” temporal cortex; II- genes that are down-regulated in “AD-like” temporal cortex and preferentially up-regulated in aged cortex; III- genes that are down-regulated in “AD-like” and preferentially up-regulated in young adult cortex. In red are shown genes that are over-expressed, in green genes that are under-expressed and in black genes without expression changes.
Figure 6
Figure 6. Gene changes in relation to their cellular function identified by gene ontology.
The 695 genes sorted by ANOVA were classified into four main modules: 1- genes involved in brain plasticity [1a-neurotransmission, 1b-neurogenesis, 1c-adhesion and extracellular matrix, 1d-cytoskeleton]; 2- genes involved in transduction and signaling [2a-ion channels, 2b-kinases, 2c-phosphatases, 2d-transferases and 2e-growth factors]; 3- genes involved in metabolism and catabolism [3a-protein synthesis and maturation, 3b-proteolysis, 3c-glucidic and lipid metabolism and 3d-mitochondrial metabolism]; 4- genes involved in nuclear activity [4a-nuclear factors, 4b-transcription regulation, 4c-cell cycle regulation, 4d-apoptosis and 4e- epigenetic control]. Red bars represent genes that are up-regulated and the green bars genes that are down-regulated in the temporal cortex of aging animals; hatched red bars represent genes that are up-regulated and hatched green bars genes that are down-regulated in the temporal cortex of “AD-like” lemurs. A. Classification with males and females together. B. Classification with females only. In aging animals genes involved in protein synthesis were more frequently up-regulated (red arrow), and the most important differences between aging and “AD-like” profiles concerned genes that have a role in protein synthesis and nuclear activity (blue arrows).The major differences between A and B are indicated by black arrows.

References

    1. Hof PR, Morrison JH. The aging brain: morphomolecular senescence of cortical circuits. Trends Neurosci. 2004;27:607–613. - PubMed
    1. Kelly KM, Nadon NL, Morrison JH, Thibault O, Barnes CA, et al. The neurobiology of aging. Epilepsy Res. 2006;68:S5–S20. - PubMed
    1. Burke SN, Barnes CA. Senescent synapses and hippocampal circuit dynamics. Trends Neurosci. 2010;33:153–161. - PMC - PubMed
    1. Mucke L. Alzheimer's disease. Nature. 2009;461:895–897. - PubMed
    1. Geschwind DH, Konopka G. Neuroscience in the era of functional genomics and systems biology. Nature. 2009;461:908–915. - PMC - PubMed

Publication types

MeSH terms