

Self-contained gene-set analysis of expression data: an evaluation of existing and novel methods
- PMID: 20862301
- PMCID: PMC2941449
- DOI: 10.1371/journal.pone.0012693
Self-contained gene-set analysis of expression data: an evaluation of existing and novel methods
Abstract
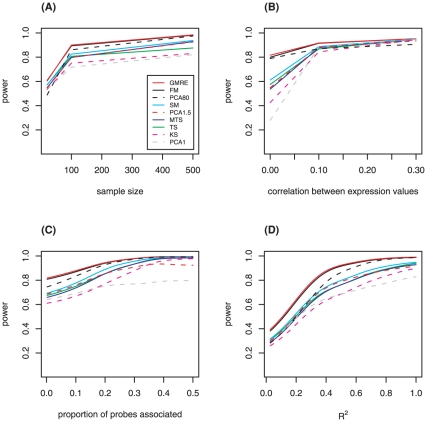
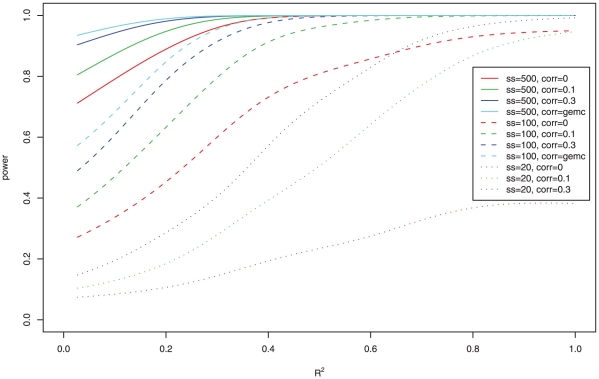
Gene set methods aim to assess the overall evidence of association of a set of genes with a phenotype, such as disease or a quantitative trait. Multiple approaches for gene set analysis of expression data have been proposed. They can be divided into two types: competitive and self-contained. Benefits of self-contained methods include that they can be used for genome-wide, candidate gene, or pathway studies, and have been reported to be more powerful than competitive methods. We therefore investigated ten self-contained methods that can be used for continuous, discrete and time-to-event phenotypes. To assess the power and type I error rate for the various previously proposed and novel approaches, an extensive simulation study was completed in which the scenarios varied according to: number of genes in a gene set, number of genes associated with the phenotype, effect sizes, correlation between expression of genes within a gene set, and the sample size. In addition to the simulated data, the various methods were applied to a pharmacogenomic study of the drug gemcitabine. Simulation results demonstrated that overall Fisher's method and the global model with random effects have the highest power for a wide range of scenarios, while the analysis based on the first principal component and Kolmogorov-Smirnov test tended to have lowest power. The methods investigated here are likely to play an important role in identifying pathways that contribute to complex traits.
Conflict of interest statement
Figures
References
-
- Goeman JJ, Buhlmann P. Analyzing gene expression data in terms of gene sets: methodological issues. Bioinformatics. 2007;23:980–987. - PubMed
-
- Dennis G, Jr, Sherman BT, Hosack DA, Yang J, Gao W, et al. DAVID: Database for Annotation, Visualization, and Integrated Discovery. Genome Biol. 2003;4:P3. - PubMed
-
- Allison DB, Cui X, Page GP, Sabripour M. Microarray data analysis: from disarray to consolidation and consensus. Nat Rev Genet. 2006;7:55–65. - PubMed
Publication types
MeSH terms
Grants and funding
LinkOut - more resources
Full Text Sources
Other Literature Sources
