. 2010 Sep 16;6(9):e1000933.
doi: 10.1371/journal.pcbi.1000933.

Plasmodium falciparum erythrocyte membrane protein 1 diversity in seven genomes--divide and conquer

Affiliations

Plasmodium falciparum erythrocyte membrane protein 1 diversity in seven genomes--divide and conquer

Thomas S Rask et al. PLoS Comput Biol. .

Abstract

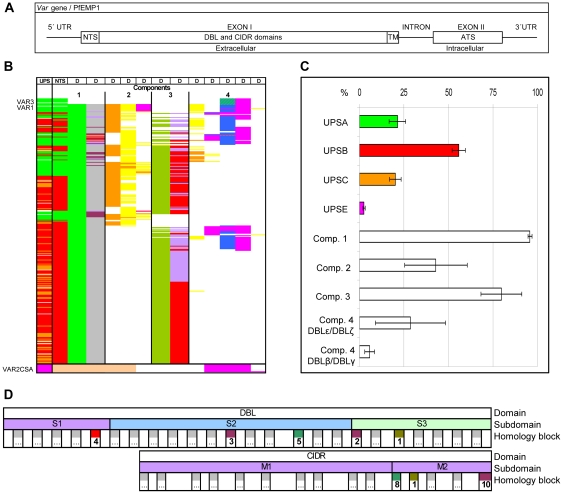
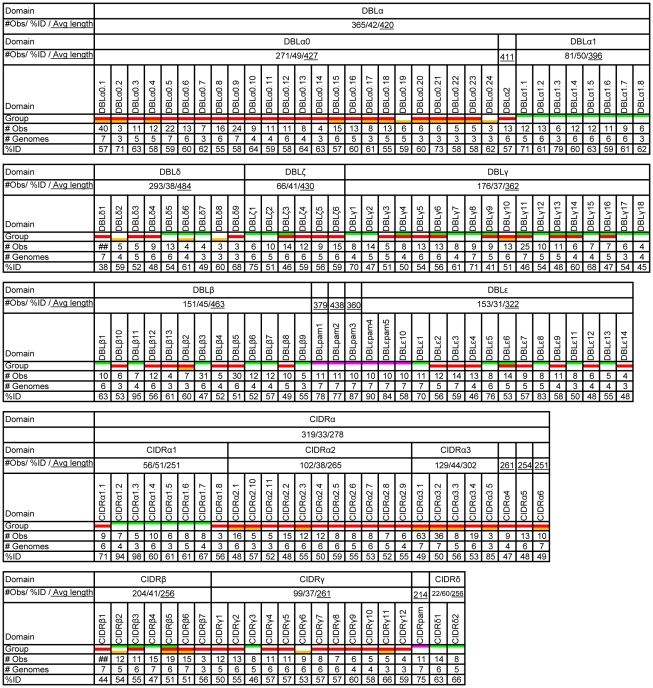
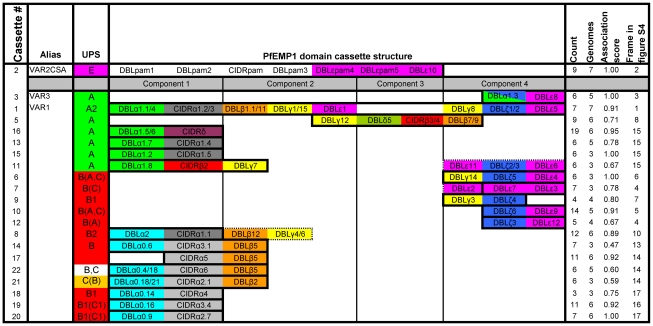
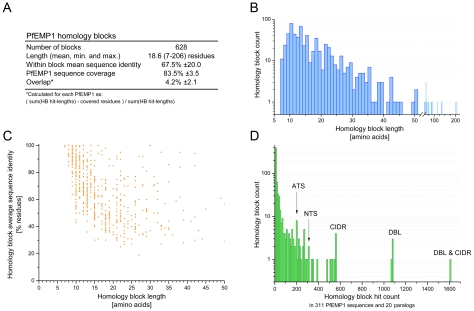
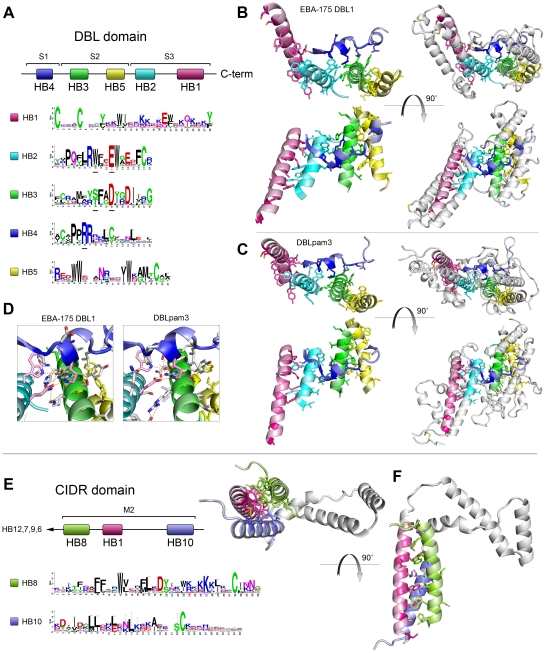
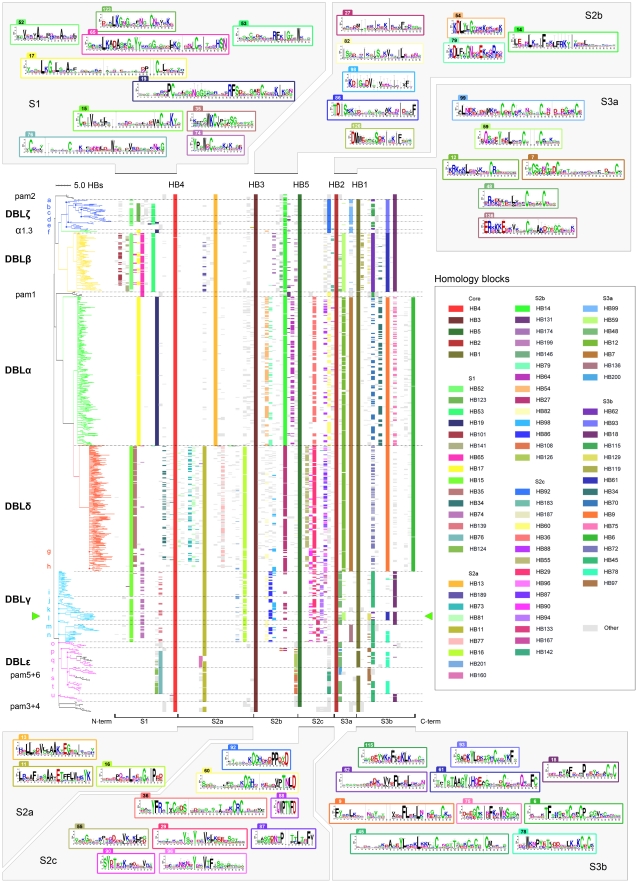
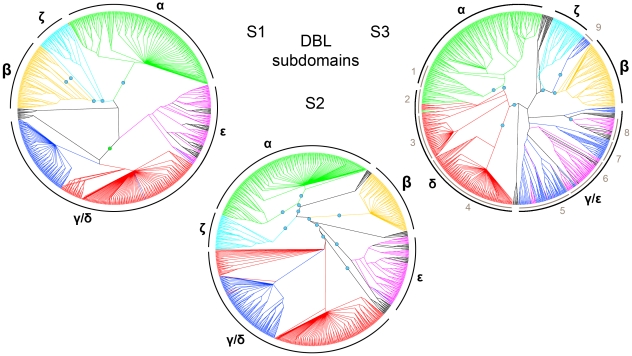
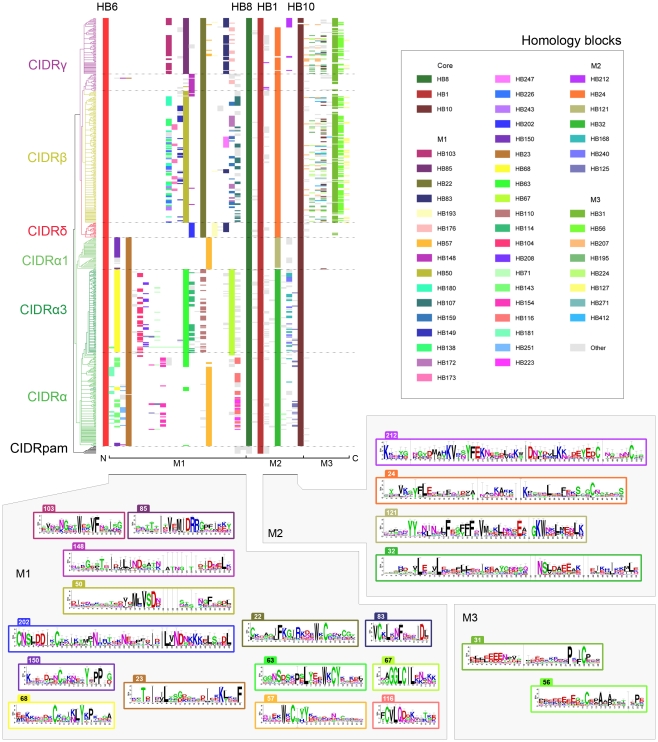
The var gene encoded hyper-variable Plasmodium falciparum erythrocyte membrane protein 1 (PfEMP1) family mediates cytoadhesion of infected erythrocytes to human endothelium. Antibodies blocking cytoadhesion are important mediators of malaria immunity acquired by endemic populations. The development of a PfEMP1 based vaccine mimicking natural acquired immunity depends on a thorough understanding of the evolved PfEMP1 diversity, balancing antigenic variation against conserved receptor binding affinities. This study redefines and reclassifies the domains of PfEMP1 from seven genomes. Analysis of domains in 399 different PfEMP1 sequences allowed identification of several novel domain classes, and a high degree of PfEMP1 domain compositional order, including conserved domain cassettes not always associated with the established group A-E division of PfEMP1. A novel iterative homology block (HB) detection method was applied, allowing identification of 628 conserved minimal PfEMP1 building blocks, describing on average 83% of a PfEMP1 sequence. Using the HBs, similarities between domain classes were determined, and Duffy binding-like (DBL) domain subclasses were found in many cases to be hybrids of major domain classes. Related to this, a recombination hotspot was uncovered between DBL subdomains S2 and S3. The VarDom server is introduced, from which information on domain classes and homology blocks can be retrieved, and new sequences can be classified. Several conserved sequence elements were found, including: (1) residues conserved in all DBL domains predicted to interact and hold together the three DBL subdomains, (2) potential integrin binding sites in DBLα domains, (3) an acylation motif conserved in group A var genes suggesting N-terminal N-myristoylation, (4) PfEMP1 inter-domain regions proposed to be elastic disordered structures, and (5) several conserved predicted phosphorylation sites. Ideally, this comprehensive categorization of PfEMP1 will provide a platform for future studies on var/PfEMP1 expression and function.


Conflict of interest statement

The authors have declared that no competing interests exist.

Figures

Figure 1
Figure 1. PfEMP1 annotation overview.
(A) Schematic of the var gene locus. (B) 399 var exon1 annotated with UPS class and encoded major NTS, DBL and CIDR domain classes and their arrangement in four components. Color code for UPS column: Green: UPSA; Red: UPSB; Orange: UPSC; Pink: UPSE. Color code for NTS column: Green NTSA, Red: NTSB, Cream: NTSpam. Color code for DBL and CIDR domains (D columns): Bright Green: DBLα; Orange: DBLβ; Yellow: DBLγ; Olive green: DBLδ; Pink: DBLε; Blue: DBLζ; Blue stripes: DBLα of VAR3. Grey: CIDRα; Red: CIDRβ; Light purple: CIDRγ; Dark purple: CIDRδ. (C) Average distribution (% +/− 95% confidence intervals) of UPSA–E flanked and component 1–4 containing genes in the seven sequenced genomes 3D7, HB3, DD2, IT4, PFCLIN, RAJ116 and IGH. (D) Schematic presentation of DBL and CIDR subdomains and homology blocks. The numbered blocks represent the core homology blocks found in all DBL domains (HB2, 3, 4 and 5), all CIDR domains (HB8 and 10) or both domain types (HB1), further described in Figure 5.
Figure 2
Figure 2. DBL and CIDR domain class characteristics.
Number of observations (#obs) of CIDR and DBL domain classes in 399 PfEMP1 (Figure S5), number of genomes represented in the classes (#genomes) (of the seven genomes 3D7, HB3, DD2, IT4, PFCLIN, RAJ116 and IGH), and the average shared sequence identity of major and minor subclasses (%ID). A color was added under domain classes where at least 25% of the observed domains were found in UPSA (green), UPSB (red), UPSC (yellow) or UPSE (pink).
Figure 3
Figure 3. Overview of distinct PfEMP1 domain cassettes.
A PfEMP1 domain cassette was defined as a var gene sequence encoding two or more DBL or CIDR domains with subclasses that could be predicted from each other. In a few cases domain cassettes (filled frames) could be expanded with additional domains but in limited number of genes or genomes (punctured frames). A cassette was given an association score calculated as the average of all domain pair associations of a domain cassette. Each domain pair association (A–B) was calculated by dividing the number of times the domain combination was observed in the dataset by the least number of times either A or B was found in the dataset. The association score does not include the UPS association. Associated UPS classes are colored according to the UPS class most often observed flanking the cassette. Less frequent flanking UPS classes are in brackets. The number of times a given domain cassette was observed (count) and the number of genomes in which it is present (genomes) within the seven genomes, 3D7, HB3, DD2, IT4, IGH, RAJ116 and PFCLIN are given. The frame number in Figure S4, detailing the genetic context of the domain cassette is also given.
Figure 4
Figure 4. Characteristics for 628 PfEMP1 homology blocks.
(A) Length corresponds to the alignment length of the multiple sequence alignment defining the HB. Sequence identity in the table is given as mean and SD for the distribution of all homology block avg. pairwise identities. HB coverage and overlap were calculated per PfEMP1 and mean and SD are given for these distributions. (B) Length distribution for HBs. The most frequent length was 10 residues. (C) Scatter plot showing avg. pairwise sequence identity for HBs of differing length. (D) Histogram showing number of HBs with same prevalences in the database. The bin size of the histogram is 10 hits. One HB was found with a prevalence of 1605 hits in the PfEMP1 database, representing a HB present in nearly all DBL and CIDR domains. Similarly, a number of homology blocks were found specifically in each of the domains DBL, CIDR, NTS and ATS. Most homology blocks had between 5 and 15 hits.
Figure 5
Figure 5. Conserved domain cores.
(A–D) Five most conserved PfEMP1 homology blocks form DBL-core structure. (A) Schematic showing relative positions in DBL domains of HB one to five (S1–3 indicate subdomains) and sequence conservation logos for each homology block alignment. The height of each position in the logos indicate the amino acid conservation level, and the height of the individual amino acids reflect their relative frequencies on the position and thus their contribution to the conservation. A small sample bias correction has been subtracted in the logos, on alignment positions containing few (<40) amino acids, and error bar height is 2× the correction. Polar amino acids are green, neutrally charged are purple, basic are blue, acidic are red, and hydrophobic amino acids are black. HB numbering is based on level of conservation in PfEMP1 and related sequences. (B) HBs shown on PfEBA-175 DBL1 structure, and (C) on VAR2CSA DBLpam3 structure. Side chains are shown for conserved positions with conservation level higher than 50% of maximum, corresponding to 2.16 bits. DBL areas which are not part of HB1–5 are shown as lightgray in rightmost column, while left side shows only HB1–5, color coding as in panel A. Coloring intensity in the structure is proportional to conservation level in the HBs. (D) Polar interactions between conserved positions in EBA-175 and DBLpam3. The conserved pink residues are underlined in Figure 5A. (E–F) Conserved sequence blocks in CIDR domains. Relative homology block positions, and sequence logos (E). HB12, 7, 9 and 6 are all strongly correlated with CIDR domains. (F) HBs shown on the structure of the M2 part of MC179 CIDRα domain. Disulfide bridges are shown in orange.
Figure 6
Figure 6. DBL homology block alignment.
HBs in 1043 DBL sequences aligned, and sorted by NJ-clustering based on differences in HB composition. Tree distances show the number of different HBs in the DBL domains. The sequences are divided into 6 segments by the conserved core HB1–5 (Figure 5), and the corresponding subdomain parts are noted below the alignment. Only the 80 most frequent of 378 HBs are colored. Sequence conservation logos as described in Figure 5 are shown for selected HBs, where number tabs indicate the HB number. Logos are when possible placed in order of appearance in the alignment. Letters next to the tree identifies groups marked by dots in the tree, matching domain subclassification based on amino acid alignments: (a) ζ3, (b) ζ5, (c) ζ6, (d) ζ4, (e) ζ1, (f) ζ2, (g) δ5, (h) δ4/8/9, (i) γ7, (j) γ11/15, (k) γ1, (l) γ2/9, (m) γ8, (n) γ5/6/12/16/17, (o) ε2, (p) ε7, (q) ε4, (r) pam6/ε3, (s) pam5/ε5/ε12, (t) ε6/9, (u) ε1/11/13. The green pointers mark products of recombination between DBLγ and DBLβ domains, with break point around HB2. Additional information for all HBs can be found by querying the VarDom server with the HB numbers, as given in the legend or on the logos. Labeled homology block alignments can be found in Figure S7.
Figure 7
Figure 7. Evolutionary relatedness of DBL subdomain sequences.
A cladogram is shown for each of the three DBL subdomains S1–3, where boundaries for the subdomains were chosen at the edges of HB4 and HB2, as shown in Figure 6. Colors indicate major DBL domain classes estimated from alignment of the whole domains: Green: DBLα; Orange: DBLβ; Blue: DBLγ; Red: DBLδ; Magenta: DBLε; Cyan: DBLζ. VAR2CSA sequences are black. Blue dots indicate major bipartitions supported by at least 50% of 1000 bootstraps. The green dot in S1 marks a bipartition with bootsrap value 0.39. Subdomain clade correlation with whole domain classes is indicated around the trees in black; Clades were split if supported by 50% of the bootstraps.
Figure 8
Figure 8. CIDR and M3 homology block alignment.
Homology blocks in CIDR domains and M3 regions were aligned, and clustered based on differences in HB composition. The cladogram is colored according to amino acid level domain classification. Only the 54 most frequent HBs are colored, out of a total 158 HBs. Sequence conservation logos are shown for selected HBs in the regions M1–3. Core homology blocks HB1, 8 and 10 are described in Figure 5, while HB6 is the C-terminal of the upstream DBLα/δ domain (Figure 6). Alignments and logos for all HBs can be found by querying the VarDom server with the HB numbers.
Figure 9
Figure 9. Helix-loop of MC179 CIDRα.
HB32 (red) covering helix a and b, and HB372 (blue) covering helix c. Side chains conserved by more than 2.16 bits are shown. Green side chains are conserved hydrophobic residues. The arrow indicates Asn in the possibly surface exposed semi-conserved motif YGN at the apex of helix a and b. The conservation of residues in HB372 with 9 sequences has a high margin of error.
Figure 10
Figure 10. NTS, ID and ATS homology blocks.
(NTS) Above the HB alignment, sequence conservation logos are shown for the two most conserved NTS homology blocks. The lower pair were found in NTS of VAR2CSA, and HB65 was also found in several DBLβ domains (Figure 6). The proposed PEXEL motif is noted above the HB20 logo, which together with several downstream positions was conserved in all PfEMP1 except VAR2CSA. On the right side of the alignment, logos covering the N-terminal methionine are shown. A conserved N-terminal N-myristoylation motif was found in NTSA HB155 and HB264. (ATS) Sequence logos for conserved ATS homology blocks marked by black dots in the alignment. The cladogram is colored according to ATS annotation based on amino acid alignment. Three conserved homology blocks were absent in VAR1 and VAR2CSA ATS. (ID) Inter-domain HBs were defined as HBs which occur with a frequency >50% outside other defined regions. Logos for three of the most conserved ID homology blocks are shown, with number of occurrences in the database with 311 PfEMP1 sequences. The phylogram is based on PfEMP1 differences in ID HB composition, where four interesting groups were distinguished: (1) VAR1, (2) VAR2CSA and PfEMP1 with C-terminal similarities to VAR2CSA defined by HB206, (3) group with UPSA flanked var including PFD1235w defined by HB295 and HB341 (4) UPSB flanked var defined by HB280. The tree is colored according to UPS type, where UPSA is green, UPSB is red, UPSC is blue and UPSE is black. Homology block sequence logos specific for group 3 and 4 in the phylogram are shown.
Figure 11
Figure 11. N-terminal N-myristoylation predictions.
(A) 48 positive NMT predictions in 311 PfEMP1 N-terminals. All except three were group A PfEMP1. According to the predictions, the post-translational modification was well conserved in all seven genomes. (B) Average pI of NTS in 311 PfEMP1. Three groups (basic, neutral and acidic) can be clearly distinguished.
Figure 12
Figure 12. PfEMP1 homology block alignment.
(a) and (b) are the same alignment, with HB1–55 colored in (a), and HB56–165 colored in (b). The sequences are sorted according to HB composition, and the tree is colored according to UPS class. The division of PfEMP1 into four components is indicated at the top of the figure. Between (a) and (b) is noted the most prevalent major domain class for that area in the alignment. The five core homology blocks should be distinguishable in (a), as well as less frequent homology blocks especially in (b). The alignment with all details can be found in Figure S7E, and the labeled tree in Figure S8. Alignment features (red arrows): (1) DBLγ-β hybrid domains; (2) The light orange column is HB78, present in both DBLγ and DBLε (Figure 6n, r, and t) and associated with C-terminal of comp. 2 and 4; (3) HB74 in DBLγ-like DBLδ domains, as in Figure 6g, h and Figure 7-S1, S2; (4) HB82 in DBLγ8 of VAR1, also found in DBLδ domains; and (5) M3 homology blocks. Notable clades in the tree: (A) VAR2CSA; (B) VAR3; (C) bootstrap 28%, 4 genomes, UPSA3, includes IT4var60 (rosetting); (D) bootstrap 25%, 3 genomes, incl. PFL0020w and PF08_0141; (E) VAR1; (F) 6 genomes, incl. MAL6P1.4; (G) 5 genomes, incl. PFD1235w and PF11_0521 (ICAM-1); (H) 5 genomes, incl. PF11_0008 and PF13_0003; (I) 4 genomes, incl. PF07_0050 and IT4var31 (CD36, ICAM-1); (J) 4 genomes, incl. IT4var14 (CD36, ICAM-1); (K) bootstrap 27%, 5 genomes, UPSB2, incl. PF08_0140 and IT4var06; (L) bootstrap 26%, 3 genomes, incl. IT4var16 (CD36, ICAM-1) and IT4var27 (rosetting); (M) bootstrap 18%, all genomes incl. MAL6P1.252 and PFL1950w; (N) bootstrap 68%, 5 genomes, UPSB; (O) bootstrap 49%, 5 genomes, UPSC1, incl. IT4var01 (rosetting) and TM284S2var1 (rosetting, IgG); and (P) Comp.1-Comp.3-ATS architecture (a.k.a. Type 1 var), UPSB and UPSC.

Similar articles

Cited by

References

    1. Baruch DI, Pasloske BL, Singh HB, Bi X, Ma XC, et al. Cloning the P. falciparum gene encoding PfEMP1, a malarial variant antigen and adherence receptor on the surface of parasitized human erythrocytes. Cell. 1995;82:77–87. - PubMed
    1. Su XZ, Heatwole VM, Wertheimer SP, Guinet F, Herrfeldt JA, et al. The large diverse gene family var encodes proteins involved in cytoadherence and antigenic variation of Plasmodium falciparum-infected erythrocytes. Cell. 1995;82:89–100. - PubMed
    1. Staalsoe T, Shulman CE, Bulmer JN, Kawuondo K, Marsh K, et al. Variant surface antigen-specific IgG and protection against clinical consequences of pregnancy-associated Plasmodium falciparum malaria. Lancet. 2004;363:283–289. - PubMed
    1. Marsh K, Howard RJ. Antigens induced on erythrocytes by P. falciparum: expression of diverse and conserved determinants. Science. 1986;231:150–153. - PubMed
    1. Fried M, Nosten F, Brockman A, Brabin BJ, Duffy PE. Maternal antibodies block malaria. Nature. 1998;395:851–852. - PubMed

Publication types

Substances