. 2010 Sep 16;6(9):e1001110.
doi: 10.1371/journal.ppat.1001110.

Cellular entry of ebola virus involves uptake by a macropinocytosis-like mechanism and subsequent trafficking through early and late endosomes

Affiliations

Cellular entry of ebola virus involves uptake by a macropinocytosis-like mechanism and subsequent trafficking through early and late endosomes

Mohammad F Saeed et al. PLoS Pathog. .

Abstract

Zaire ebolavirus (ZEBOV), a highly pathogenic zoonotic virus, poses serious public health, ecological and potential bioterrorism threats. Currently no specific therapy or vaccine is available. Virus entry is an attractive target for therapeutic intervention. However, current knowledge of the ZEBOV entry mechanism is limited. While it is known that ZEBOV enters cells through endocytosis, which of the cellular endocytic mechanisms used remains unclear. Previous studies have produced differing outcomes, indicating potential involvement of multiple routes but many of these studies were performed using noninfectious surrogate systems such as pseudotyped retroviral particles, which may not accurately recapitulate the entry characteristics of the morphologically distinct wild type virus. Here we used replication-competent infectious ZEBOV as well as morphologically similar virus-like particles in specific infection and entry assays to demonstrate that in HEK293T and Vero cells internalization of ZEBOV is independent of clathrin, caveolae, and dynamin. Instead the uptake mechanism has features of macropinocytosis. The binding of virus to cells appears to directly stimulate fluid phase uptake as well as localized actin polymerization. Inhibition of key regulators of macropinocytosis including Pak1 and CtBP/BARS as well as treatment with the drug EIPA, which affects macropinosome formation, resulted in significant reduction in ZEBOV entry and infection. It is also shown that following internalization, the virus enters the endolysosomal pathway and is trafficked through early and late endosomes, but the exact site of membrane fusion and nucleocapsid penetration in the cytoplasm remains unclear. This study identifies the route for ZEBOV entry and identifies the key cellular factors required for the uptake of this filamentous virus. The findings greatly expand our understanding of the ZEBOV entry mechanism that can be applied to development of new therapeutics as well as provide potential insight into the trafficking and entry mechanism of other filoviruses.


Conflict of interest statement

The authors have declared that no competing interests exist.

Figures

Figure 1
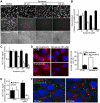
Figure 1. Clathrin and caveolar endocytosis are not required for ZEBOV entry.
(A) Regulators of clathrin and caveolae-mediated endocytosis are not important for ZEBOV infection. The role of proteins important for endocytosis in ZEBOV infection was assessed using dominant negative (DN) effector proteins. HEK293T cells were transfected with plasmids encoding GFP, DN-Eps15-GFP or DN-Cav1-GFP. Twenty-four h post-transfection cells were inoculated with wild-type ZEBOV (MOI  = 0.2). Cells were fixed 48 h later, stained for nuclei using DAPI and for ZEBOV VP40 matrix protein using a specific rabbit antiserum followed by Alexa633 secondary antibody. Images were taken by fluorescence microscopy and analyzed as described in the methods. To quantitate the infection dependency of ZEBOV on expression of each construct, the proportion of cells that were expressing each GFP-tagged fusion protein and infected by ZEBOV was calculated as a fraction of the total cell population. The data were averaged for all replicates (>5) and normalized to that seen in cells transfected with GFP alone. (B) To measure the impact of expression of each GFP-tagged protein on the virus entry step into cells, a contents mixing assay was performed. Cells were transfected as above and then used in the assay 36 h after transfection. Both ZEBO-VLPs and VSV-G pseudotyped particles were used as indicated. Measurements were made at 3 h, at which time the contents mixing signal peaked in untreated cells (peak is at 2–3 h post cell binding). Measurements were normalized to untransfected cells. The results are mean ± st.dev. of 3 independent experiments. (C) To test DN-Cav1 efficacy, HEK293 cells were transfected with plasmids encoding GFP or DN-Cav1 tagged with GFP. Thirty six hours after transfection cells were infected with a recombinant 10A1 MLV virus encoding a truncated CD4 receptor as a marker for infection. 36 h after the infection cells were stained for CD4 expression with anti-CD4 antibody conjugated to PE (red) and cells expressing CD4 and the GFP-tagged protein by microscopy. Data were analyzed as described in the methods and in (A). (D) Cholera toxin B subunit uptake is blocked in cells expressing DN-Cav-1. As an additional test of DN-Cav-1 efficacy, the impact of expression on cholera toxin subunit B (CTxB) uptake was measured. HEK293T cells were transfected with plasmid encoding GFP (left panel) or GFP-tagged DN-Cav1 protein (right panel). Thirty-six h after transfection cells were incubated with fluorescently-labeled CTxB for 30 or 60 min, fixed and imaged. Images were taken by confocal microscopy with a mid z-section shown. Green  =  GFP or DN-Cav1; Red  =  CTxB. (E) ZEBO-VLPs do not associate with markers of caveolae or clathrin-coated endosomes. Vero cells were preincubated with gfpZEBO-VLPs at 16°C (to prevent endocytosis) for 15 min to allow virus attachment. Excess virus was then removed and the temperature raised to 37°C (to initiate endocytosis) prior to fixation at indicated times. For caveolin-1 and clathrin light chain A, permeabilized cells were stained with anti-Cav1 antibody or anti-CLCA antibody followed by Alexafluor594-conjugated secondary antibody. For transferrin, Alexafluor594-labeled transferrin was added to cells during incubation with the VLPs. DAPI was used to stain nuclei (blue). Images were taken by confocal microscopy with a mid z-section shown. Green  =  gfpZEBO-VLPs; Red  =  indicated endocytic marker.
Figure 2
Figure 2. ZEBOV entry does not require dynamin activity.
(A) Dynasore does not affect ZEBOV infection. Vero cells pretreated with the indicated doses of dynasore were incubated with either GFP-expressing infectious ZEBOV (gfpZEBOV, top panel) or RFP-expressing infectious VSV (rfpVSV, middle panel) in the continued presence of the drug (MOI  = 0.1). After 24 h, cells were washed and fixed with 10% formalin and images taken using an epifluorescence microscope. Phase-contrast microscopy was also performed to ensure cell monolayers were intact (bottom panel). (B) The bar graph shows quantitation of data shown in (A). For this, green fluorescent cells were counted using Cell Profiler software (Broad Inst., MA) and normalized to the average of the untreated control. At least 4 sets of images were analyzed. Solid bars represent infection by gfpZEBOV and open bars represent rfpVSV. Similar results were obtained with HEK293T cells (not shown). (C) Dynasore does not affect cell entry of ZEBO-VLPs. Entry assays were performed with HEK293T cells after pre-incubation with dynasore for 1 h. Cells were then challenged with luciferase containing ZEBO-VLP (solid bars) or VSV-VLP (open bars) for 3 h in the continued presence of the drug. Subsequently, cells were washed and incubated with luciferase assay buffer and luciferase activity was measured. The results are expressed as luciferase activity relative to that in untreated cells. The data represents average ± st.dev. of 3 independent experiments each performed in duplicate. (D) Dynasore blocks CTxB and transferrin uptake. To confirm the activity of dynasore, Vero cells (untreated or pre-treated with 50 µM dynasore) were incubated with Alexafluor594-labeled cholera toxin B subunit (CTxB) or transferrin (both red). After 1 h, cells were fixed and analyzed by fluorescence microscopy for uptake of each marker as indicated. Nuclei (blue) were stained with DAPI. The bar graph (right panel) shows the relative amount of each probe taken up by cells, which was determined by calculating the mean pixel intensity of the probe signal per unit area and expressed as the average of 10 cells. (E) Dominant negative dynamin does not affect ZEBO-VLP cell entry. Effect of DN-dynamin on VLP entry was determined by using HEK293T cells transfected with plasmid encoding GFP alone or DN dynamin2 (K44A)-GFP fusion protein (DN-Dyn2-GFP). Twenty-four h post-transfection, cells were incubated with ZEBO-VLP or VSV-VLP for 3 h. Luciferase activity was then measured in each sample and expressed relative to that in control (untransfected) cells. The data represents average ± st.dev. of 3 independent experiments, each performed in duplicate. (F) ZEBO-VLPs do not colocalize with endogenous dynamin. VLP colocalization with dynamin was tested by binding gfpZEBO-VLPs to HEK293T cells at 16°C for 15 min. Cells were then shifted to 37°C to allow VLP uptake and fixed at 15 or 60 min. They were then permeabilized and stained with anti-dynamin-2 antibody and Alexafluor594-conjugated secondary antibody. Images were taken with a confocal microscope with mid z-sections shown. Nuclei (blue) were stained with DAPI. Green  =  gfpZEBO-VLPs; Red  =  endogenous dynamin-2.
Figure 3
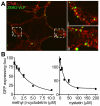
Figure 3. Cholesterol-enriched lipid raft microdomains are important for ZEBOV entry.
(A) ZEBO-VLPs associate with lipid rafts. Vero cells were incubated with gfpZEBO-VLP (green) at 37°C for 15 min and unbound virus was removed by washing. Lipid rafts were visualized by first incubating the cells with Alexafluor594-labeled CTxB (red) followed by coalescing the small raft domains with anti-CTxB antibody. The samples were then fixed and images taken by confocal microscopy. A mid z-section of the cells is shown. Insets i and ii are enlarged images of the indicated areas. (B) Cholesterol sequestering drugs inhibit ZEBOV infection. Vero cells were pretreated with the indicated concentrations of methyl-β cyclodextrin or nystatin for 1 h. Cells were then washed extensively to remove the drugs, and gfpZEBOV was added at an MOI of 0.1. After 24 h, cells were washed and fixed. Images were then taken with a 10× objective lens. The number of foci of infected (gfp-expressing) cells were counted for 4 images per sample in duplicate. The average number of foci is indicated ± st.dev. Similar results were obtained with HEK293T cells (not shown).
Figure 4
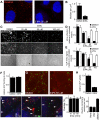
Figure 4. ZEBOV uptake and infection is inhibited by EIPA and VLP uptake is associated with dextran containing vesicles.
(A) EIPA inhibits dextran accumulation into vesicles. Vero cells were treated with DMSO or EIPA (50 uM) for 30 min. Subsequently, cells were incubated with Alexafluor594-labeled dextran (1 mg/ml) in the presence of the inhibitor. After 30 min, cells were washed, fixed and observed by confocal microscopy. Nuclei (blue) were stained with DAPI. Images were taken using a 100× oil immersion objective lens. (B) Accumulation of dextran in cells was analyzed by counting the total number of macropinocytic vesicles (occupying >0.25 µm2 in images) relative to the area occupied by the cell. (C) EIPA blocks ZEBOV infection. Vero cells were pre-treated with the indicated concentrations of EIPA, followed by incubation with gfpZEBOV (top panel) or rfpVSV (middle panel) each at MOI of 0.1 in the continued presence of the drug. Control cells received DMSO instead of the drug. After 24 h, cells were washed and fixed. Virus infection was determined by counting fluorescent foci. Cell monolayer integrity was confirmed by phase-contrast microscopy (bottom panel). (D) Quantitation of data shown in (C). Solid bars represent gfpZEBOV and open bars represent rfpVSV. Data were normalized to the average number of foci seen for untreated cells. Similar results were obtained when HEK293T cells were used (not shown). (E) EIPA-mediated block is at the entry step of infection. The mechanism of the EIPA-mediated inhibition of infection was examined by performing entry assays. HEK293T cells were pre-treated with the indicated concentrations of EIPA for 1 h followed by incubation with ZEBO-VLP (solid bars) or VSV-VLP (open bars) for an additional 3 h in the continued presence of the drug. Subsequently, cells were washed, and luciferase activity was measured for each sample. The results are expressed as luciferase activity relative to that in control (DMSO-treated) cells. The data represents average ± st.dev. of 3 independent experiments each performed in duplicate. (F) EIPA does not affect ZEBO-VLP binding to cells. HEK293 cells were pre-treated with EIPA (50 µM) for 1 h at 37°C, followed by incubation with ZEBO-VLPs for 10 min at room temperature. Cells were then washed to remove unbound virus, resuspended in luciferase assay buffer containing triton X-100 detergent, and luciferase activity was measured. Data were normalized to luciferase activity in vehicle-treated samples. Each data point represents mean ± st.dev. of 3 experiments. (G) EIPA treatment inhibits cellular uptake of ZEBO-VLPs. Vero cells were treated with DMSO or EIPA (50 µM) for 30 min. Subsequently, cells were incubated with gfpZEBO-VLP (green) in the presence of the inhibitor. After 30 min, cells were washed, fixed and the cell periphery was visualized by staining with phalloidin (red), staining cortical actin. Images were taken by confocal microscopy using 100× oil immersion objective lens. Only the mid-optical section representing the cell interior is shown. (H) VLP uptake was quantified by counting the total number of internalized VLPs in cells in each image (4–6 cells/image). A total of 10 images were analyzed for each sample. The data are presented as average number of VLPs per cell ± st.dev. (I) Internalized ZEBO-VLPs colocalize with dextran. HEK293T cells were incubated with gfpZEBO-VLP at 16°C. After 15 min, samples were washed and incubated with Alexafluor594-labeled dextran 10,000 W (1 mg/ml) at 37°C. At indicated time intervals, cells were fixed and analyzed by confocal microscopy. Each image represents a mid optical section. Arrowheads indicate examples of association between gfpZEBO-VLPs (green) with dextran-containing vesicles (red). Nuclei (blue) were stained with DAPI. Quantitation of VLP colocalization (right panel). Multiple sections of each image were analyzed for VLPs that exhibited colocalization with dextran and their number expressed as percent of total VLPs in those sections. At least 10 images (5–6 cells/image) were analyzed for each sample. Mean ± st.dev. are shown. Note: this is likely an underestimate of the association as VLPs out of the plane or close to but not completely overlapping dextran positive vesicles were not counted. (J) ZEBOV induces dextran uptake by cells. Vero cells were incubated with replication-competent VSV or ZEBOV (MOI  = 5) for 15 min. Control cells were incubated with growth medium alone (none). Cells were then washed and incubated with medium containing fluorescently-labeled dextran 10,000 MW (1 mg/ml). After 30 min, cells were washed and fixed. Images were then taken by confocal microscopy using a 100× oil immersion objective lens, and the number of dextran-containing vesicles in individual cells were counted. For each sample, at least 10 images (≥25 cells) representing randomly selected fields were analyzed. The data represent mean ± st.dev. of dextran-containing vesicles/cell. A similar outcome was observed when HEK293T cells were incubated with ZEBO-VLP (not shown).
Figure 5
Figure 5. Actin and actin regulatory proteins are important for ZEBOV infection.
(A) Suppression of Pak1 by siRNA blocks ZEBOV infection. HEK293 cells were transfected with siRNA targeting Pak1 (two distinct siRNA, i and ii, used) or non-targeting siRNA. Expression of Pak1 was evaluated by Western blot using an appropriate antibody (Cell Signaling Technology, MA) and relative peak intensity determined by densitometry using a Typhoon scanner and associated software (GE Biosciences, NJ). The impact of Pak1 suppression on gfpZEBOV infection was then determined and expressed relative to untransfected controls. (B) DN Pak1 reduces ZEBOV infection. HEK293T cells were transfected with plasmids encoding β-galactosidase (β-gal) or myc/GST-tagged forms of wt Pak1 or DN-Pak1. 36 h later, cells were infected with gfpZEBOV and after 24 h were fixed and stained for myc or GST tags using appropriate primary and secondary antibodies. Cells were then imaged and analyzed as in the methods. The proportion of cells that were expressing each tagged protein and infected by ZEBOV was calculated as a fraction of the total cell population and expressed relative to the infection seen for cells transfected with plasmid encoding β-galactosidase. (C) Suppression of CtBP/BARS by siRNA blocks ZEBOV infection. HEK293 cells were transfected with siRNA targeting CtBP/BARS (two used, i and ii) or non-targeting or firefly luciferase (luc) targeting siRNA. Expression levels were determined by evaluating immunofluorescent staining intensity of CtBP/BARS in nuclei of each cell (CtBP/BARS is predominantly localized to cell nucleus) and normalizing to the nuclear stain, DAPI and untransfected controls. The left panel shows portion of microscope image with cell nuclei stained with DAPI or CtBP/BARS antibody and center panel shows quantitation of staining from 20,000 cells. Right panel shows impact on infection by ZEBOV-GFP. (D) ZEBOV induces Arp2-nucleation. Vero cells were incubated in medium without virus or replication-competent infectious ZEBOV (MOI  = 5) for the indicated time. Subsequently cells were washed, fixed, permeabilized and stained for Arp2 protein using a specific antibody. The number and apparent size of Arp2 complexes was analyzed using the Analyze particles function of ImageJ software (http://rsbweb.nih.gov/ij/). While total number of Arp2 clusters did not change, the size distribution was altered by ZEBOV incubation with cells. This was expressed as the number of Arp2 complexes of the size ranges indicated (area occupied in image) relative to the total number of complexes (*-P<0.05, **-P<0.01). (E) Images showing Arp2 nucleation. Arp2 (red), DAPI stained nuclei (blue). Images were taken by confocal microscopy using a 100× oil immersion objective lens. (F) ZEBO-VLPs associate with Arp2 complexes. Vero cells were incubated with gfpZEBO-VLPs (green) for 30 min and then fixed, permeabilized and stained for Arp2 (red) using appropriate antibodies. (G) ZEBO-VLPs associate with actin foci and (H) VASP protein during cell entry. Vero cells were incubated with fluorescently-labeled ZEBO-VLPs or VSV-VLPs (green). After 30 min, cells were washed, fixed and permeabilized. For actin staining, cells were incubated with medium containing fluorescently-labeled phalloidin (red). For VASP staining, cells were incubated with anti-phospho-VASP antibody, followed by fluorescently-labeled secondary antibody (red). Arrowheads indicate representative examples of VLP colocalization with actin or VASP. All Images were taken by confocal microscopy using a 100× objective lens.
Figure 6
Figure 6. ZEBOV trafficking involves early and late endosomes.
(A) ZEBO-VLPs colocalize with vesicles bearing early endosomal antigen-1 (EEA1) shortly after internalization. HEK293T cells were incubated with fluorescently-labeled ZEBO-VLPs (green) for 10 min at 16°C. After washing to remove unbound VLPs, fresh growth medium was added to cells, which were then incubated at 37°C. At the indicated time cells were fixed, permeabilized and stained for EEA1 (red). Nuclei (blue) were stained with DAPI. Images were taken by confocal microscopy using a 100× oil immersion objective lens. A representative image of mid-optical z-section is shown for each time point. (B) Quantitation of VLP colocalization. VLPs colocalized with EEA1 were counted and expressed as percent of total VLPs in image sections. At least 10 images (5–6 cells/image) were analyzed for each sample. Mean ± st.dev. are presented in the data. (C) ZEBOV requires Rab5 and Rab7 function. HEK293T cells were made to express GFP or GFP-tagged forms of DN Rab5, DN Rab7 by plasmid transfection. Twenty-four h post-transfection cells were incubated with wild-type ZEBOV for 48 h. Cells were fixed after 36 h and immunostained for ZEBOV VP40 matrix protein as a marker of infection. Nuclei were stained with DAPI and images were taken by fluorescence microscopy. Image analysis was performed using Cell Profiler software (Broad Inst. MA) as described in methods. The proportion of cells that were expressing each GFP-tagged fusion protein and infected by ZEBOV was calculated as a fraction of the total cell population and averaged for all replicates (>5). Data were normalized to that seen in cells transfected with GFP alone. (D) Rab5 and Rab7 function is necessary for the cell entry step of infection. To determine the step of infection that was affected by each DN protein, entry assays were performed using HEK293Tcells expressing GFP, or GFP-tagged forms of wild-type Rab5, DN Rab5 or DN Rab7. Cells were incubated with VSV-VLP (open bars) or ZEBO-VLP (solid bars) for 3 h. Subsequently, luciferase activity was measured in each sample and expressed relative to that in control (untransfected) cells. The data represents average ± st.dev. of 3 independent experiments, each performed in duplicate.

References

    1. Hoenen T, Groseth A, Falzarano D, Feldmann H. Ebola virus: unravelling pathogenesis to combat a deadly disease. Trends Mol Med. 2006;12:206–215. - PubMed
    1. Leroy EM, Rouquet P, Formenty P, Souquiere S, Kilbourne A, et al. Multiple Ebola virus transmission events and rapid decline of central African wildlife. Science. 2004;303:387–390. - PubMed
    1. Ellis DS, Simpson IH, Francis DP, Knobloch J, Bowen ET, et al. Ultrastructure of Ebola virus particles in human liver. J Clin Pathol. 1978;31:201–208. - PMC - PubMed
    1. Feldmann H, Klenk HD, Sanchez A. Molecular biology and evolution of filoviruses. Arch Virol. 1993;Suppl 7:81–100. - PubMed
    1. Dolnik O, Kolesnikova L, Becker S. Filoviruses: Interactions with the host cell. Cell Mol Life Sci. 2008;65:756–776. - PMC - PubMed

Publication types

MeSH terms