. 2011 Jan;88(1):63-74.
doi: 10.1007/s00223-010-9418-4. Epub 2010 Sep 23.

Jaw and long bone marrows have a different osteoclastogenic potential

Affiliations

Jaw and long bone marrows have a different osteoclastogenic potential

Ana Paula de Souza Faloni et al. Calcif Tissue Int. 2011 Jan.

Abstract

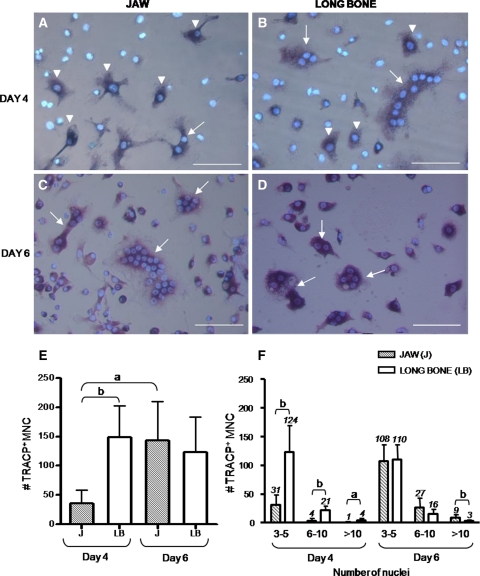
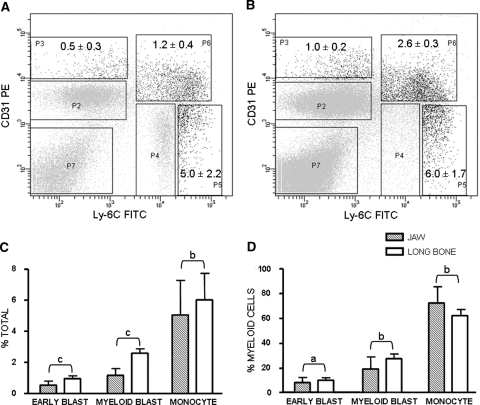
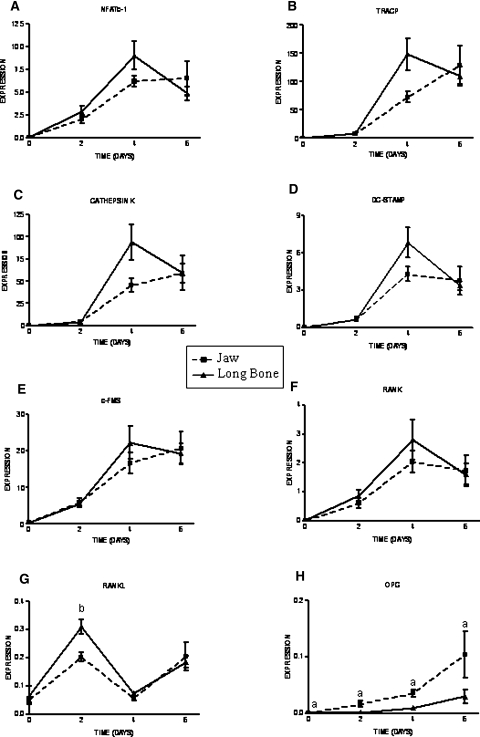
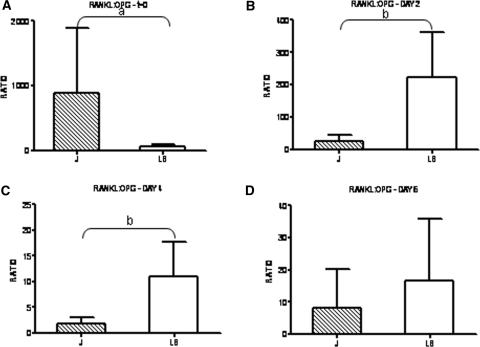
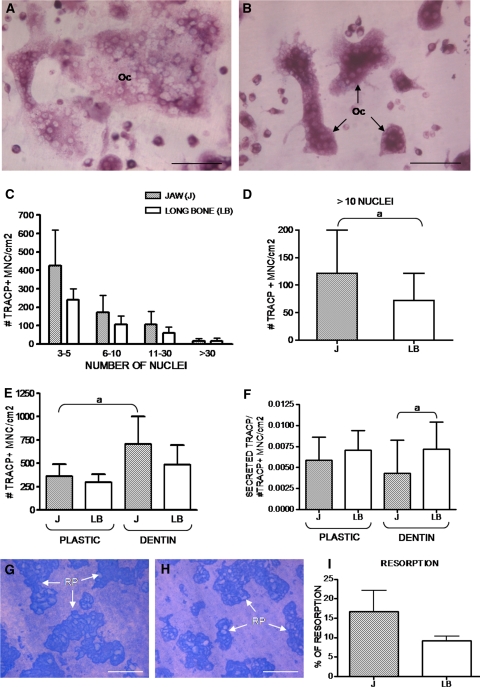
Osteoclasts, the multinucleated bone-resorbing cells, arise through fusion of precursors from the myeloid lineage. However, not all osteoclasts are alike; osteoclasts at different bone sites appear to differ in numerous respects. We investigated whether bone marrow cells obtained from jaw and long bone differed in their osteoclastogenic potential. Bone marrow cells from murine mandible and tibiae were isolated and cultured for 4 and 6 days on plastic or 6 and 10 days on dentin. Osteoclastogenesis was assessed by counting the number of TRAP(+) multinucleated cells. Bone marrow cell composition was analyzed by FACS. The expression of osteoclast- and osteoclastogenesis-related genes was studied by qPCR. TRAP activity and resorptive activity of osteoclasts were measured by absorbance and morphometric analyses, respectively. At day 4 more osteoclasts were formed in long bone cultures than in jaw cultures. At day 6 the difference in number was no longer observed. The jaw cultures, however, contained more large osteoclasts on plastic and on dentin. Long bone marrow contained more osteoclast precursors, in particular the myeloid blasts, and qPCR revealed that the RANKL:OPG ratio was higher in long bone cultures. TRAP expression was higher for the long bone cultures on dentin. Although jaw osteoclasts were larger than long bone osteoclasts, no differences were found between their resorptive activities. In conclusion, bone marrow cells from different skeletal locations (jaw and long bone) have different dynamics of osteoclastogenesis. We propose that this is primarily due to differences in the cellular composition of the bone site-specific marrow.


Figures

Fig. 1
Fig. 1
MicroCT cross section of a mouse lower jaw. Arrows indicate marrow cavities in the molar (M) area. For the isolation of bone marrow of the lower jaw, the incisor (I) and the frontal and distal jaw bone were dissected. The remaining molar block with accompanying bone marrow cavities was crunched, and a cell suspension containing bone marrow was isolated. MicroCT was generously provided by Dr. Lars Mulder (Department of Anatomy, Academic Center for Dentistry Amsterdam, Amsterdam, The Netherlands)
Fig. 2
Fig. 2
TRAP+ multinucleated cells formed from jaw (a, c) and long bone (b, d) precursors, after 4 (a, b) and 6 (c, d) days of culture on plastic. a Most of the TRAP+ cells shown here are mononuclear (arrowheads) and only one cell has more than one nucleus (arrow). b Large TRAP+ multinucleated cells (arrows) are apparent, and only a few TRAP+ mononucleated cells are observed (arrowheads). c Large TRAP+ multinucleated cells with several nuclei (arrows) are seen. d Small TRAP+ multinucleated cells (arrows) are observed. TRAP reaction counterstained with DAPI. Bars = 100 μm. e Total number of TRAP+ multinucleated cells formed by the jaw and long bone precursors, after 4 and 6 days of culture on plastic. On day 4, the number of TRAP+ multinucleated cells formed by the long bone precursors is approximately threefold higher than in the jaw cultures. This difference is no longer apparent at day 6. f If the TRAP+ multinucleated cells are categorized according to the number of nuclei, on day 4, the number of osteoclasts exhibiting 3–5, 6–10, and more than 10 nuclei is significantly higher in the long bone cultures in comparison to the jaw cultures. On day 6, this difference is no longer observed. However, on day 6, the number of large osteoclasts with more than 10 nuclei is significantly higher in the jaw cultures. For both periods (4 and 6 days), most of the osteoclasts contained 3–5 nuclei. Data are expressed as mean ± SD. The mean number of cells is given on top of each bar. Results from four experiments (n = 3 mice per experiment) are shown. a P < 0.05, b P < 0.01
Fig. 3
Fig. 3
Two-color flow-cytometric analysis of mouse bone marrow from jaw (a) and long bone (b). Cells were labeled with anti-CD31 and anti-Ly-6C. Percentages of cells found per gated area are indicated (n = 12 mice from four experiments). Bold lettering: subpopulations highly enriched in early blasts (P3), myeloid blasts (P6), and monocytes (P5). Other fractions mainly contain lymphocytes (P2), erythroid blasts (P7), or granulocytes (P4). c Among the total population of bone marrow cells, the percentage of myeloid cells (early blasts, myeloid blasts, and monocytes) was significantly higher in the long bone marrow in comparison with the jaw. d Within the myeloid cells, the number of myeloid blasts and early blasts were higher in long bone marrow, whereas jaw bone marrow contained relatively more monocytes. The other fractions mainly contained lymphocytes, erythroid blasts, or granulocytes. Data are expressed as mean ± SD. a P < 0.05, b P < 0.01, c P < 0.001
Fig. 4
Fig. 4
Kinetics of gene expression in bone marrow cultures from jaw and long bone stimulated with RANKL and M-CSF. Expression was assessed at t = 0 and on days 2, 4, and 6. During this culture period, the genes NFATc-1 (a), TRAP (b), cathepsin K (c), DC-STAMP (d), c-FMS (e), and RANK (f) were upregulated. For long bone cultures, highest expression was reached on day 4 for most of the genes. From day 2 to day 4, long bone cultures tended to show a higher increase in gene expression than jaw cells. From day 4 to day 6, most of the genes in the long bone cultures showed a decrease in expression, whereas the jaw gene expression continued to increase or remained at the same level. Expression of RANKL (g) and OPG (h) was distinct from that of the other genes. On day 2, expression of RANKL was significantly higher in long bone cultures in comparison to jaw cultures. Overall, except for t = 0 (when long bone expression was higher than that from the jaw), expression of OPG was significantly higher for precursors and cultures from jaw. Expression was normalized for PBGD, expression of which was stable for all samples. Results (mean ± SEM) obtained from two experiments (n = 3 mice per experiment) are shown. a P < 0.05, b P < 0.01
Fig. 5
Fig. 5
Ratio of RANKL:OPG expression in jaw and long bone cultures. RANKL:OPG ratio was higher for the jaw at t = 0 (a), whereas it was significantly higher for long bone cells at 2 (b) and 4 (c) days. On day 6 (d), there was no significant difference between jaw and long bone. Data are expressed as mean ± SD. a P < 0.05, b P < 0.01
Fig. 6
Fig. 6
Osteoclasts formed from jaw (a) and long bone (b) precursors cultured on dentin for 6 days. a A huge osteoclast (Oc) that contains more than 50 nuclei. b Relatively small osteoclast with high cytoplasmic TRAP activity. Bars = 100 μm. c Total numbers of multinucleated osteoclasts formed on dentin from jaw and long bone marrow precursors were not different if grouped in the categories as indicated. d However, if all cells with more than 10 nuclei were grouped together, a significantly higher number was found in jaw cultures. e Comparing the cells formed on plastic and dentin, a higher number of jaw osteoclasts were formed on dentin compared to the number formed on plastic. No significant differences were observed for long bone cultures. f Levels of TRAP enzyme secreted in the medium were not different between jaw and long bone cultures on plastic. On dentin long bone osteoclasts released higher levels of TRAP. g, h Examples are shown of resorption pits (RP, arrows) generated by jaw (g) and long bone (h) marrow precursor-derived osteoclasts, until day 10. Bars = 100 μm. i Percentage of resorption. After 10 days’ culture, the percent of resorption by jaw- and long bone-derived osteoclasts was not different. Percent of resorption was from two experiments (n = 3 mice per experiment) and expressed as mean ± SD. a P < 0.05

References

    1. Quinn JMW, Neale S, McGee JOD, Athanasou NA. Human osteoclast formation from blood monocytes, peritoneal macrophages, and bone marrow cells. Calcif Tissue Int. 1998;62:527–531. doi: 10.1007/s002239900473. - DOI - PubMed
    1. Jacquin C, Gran DE, Lee SK, Lorenzo JA, Aguila HL. Identification of multiple osteoclast precursor populations in murine bone marrow. J Bone Miner Res. 2006;21:67–77. doi: 10.1359/JBMR.051007. - DOI - PubMed
    1. De Vries TJ, Schoenmaker T, Hooibrink B, Leenen PJ, Everts V. Myeloid blasts are the mouse bone marrow cells prone to differentiate into osteoclasts. J Leukoc Biol. 2009;85:919–927. doi: 10.1189/jlb.0708402. - DOI - PubMed
    1. Everts V, de Vries TJ, Helfrich MH. Osteoclast heterogeneity: lessons from osteopetrosis and inflammatory conditions. Biochim Biophys Acta. 2009;1792:757–765. - PubMed
    1. Everts V, Korper W, Jansen DC, Steinfort J, Lammerse I, Heera S, Docherty AJ, Beertsen W. Functional heterogeneity of osteoclasts: matrix metalloproteinases participate in osteoclastic resorption of calvarial bone but not in resorption of long bone. FASEB J. 1999;13:1219–1230. - PubMed

MeSH terms

LinkOut - more resources